
 Yahoo Finance
 How Does First Horizon National's (NYSE:FHN) P/E Compare To Its Industry, After The Share Price Drop?

Unfortunately for some shareholders, the First Horizon National (NYSE:FHN) share price has dived 39% in the last thirty days. Indeed the recent decline has arguably caused some bitterness for shareholders who have held through the 32% drop over twelve months.
Assuming nothing else has changed, a lower share price makes a stock more attractive to potential buyers. In the long term, share prices tend to follow earnings per share, but in the short term prices bounce around in response to short term factors (which are not always obvious). So, on certain occasions, long term focussed investors try to take advantage of pessimistic expectations to buy shares at a better price. Perhaps the simplest way to get a read on investors' expectations of a business is to look at its Price to Earnings Ratio (PE Ratio). A high P/E ratio means that investors have a high expectation about future growth, while a low P/E ratio means they have low expectations about future growth.
Check out our latest analysis for First Horizon National
Does First Horizon National Have A Relatively High Or Low P/E For Its Industry?
We can tell from its P/E ratio of 7.29 that sentiment around First Horizon National isn't particularly high. If you look at the image below, you can see First Horizon National has a lower P/E than the average (10.5) in the banks industry classification.
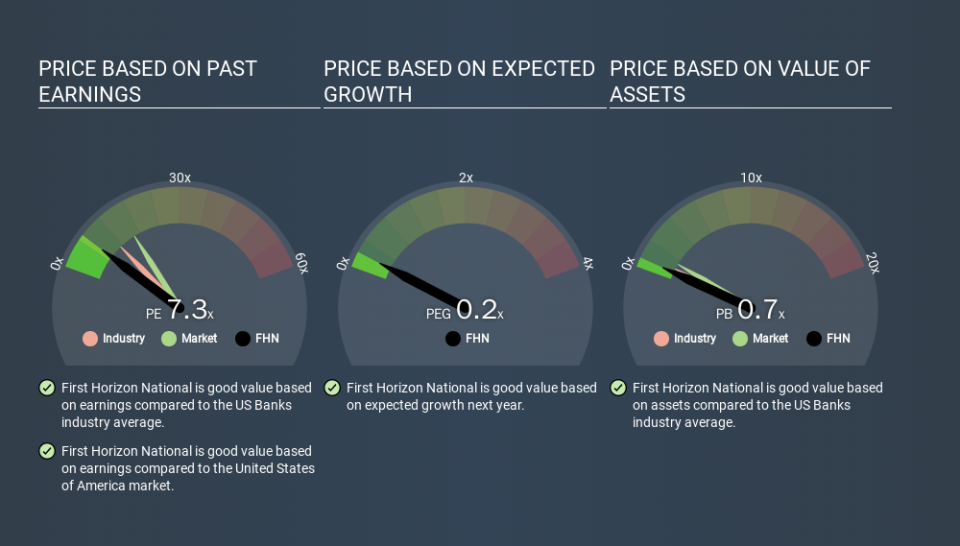
First Horizon National's P/E tells us that market participants think it will not fare as well as its peers in the same industry. While current expectations are low, the stock could be undervalued if the situation is better than the market assumes. You should delve deeper. I like to check if company insiders have been buying or selling.
How Growth Rates Impact P/E Ratios
Earnings growth rates have a big influence on P/E ratios. When earnings grow, the 'E' increases, over time. That means unless the share price increases, the P/E will reduce in a few years. A lower P/E should indicate the stock is cheap relative to others -- and that may attract buyers.
First Horizon National shrunk earnings per share by 17% over the last year. But it has grown its earnings per share by 8.5% per year over the last five years.
Don't Forget: The P/E Does Not Account For Debt or Bank Deposits
Don't forget that the P/E ratio considers market capitalization. Thus, the metric does not reflect cash or debt held by the company. In theory, a company can lower its future P/E ratio by using cash or debt to invest in growth.
Such spending might be good or bad, overall, but the key point here is that you need to look at debt to understand the P/E ratio in context.
How Does First Horizon National's Debt Impact Its P/E Ratio?
Net debt is 47% of First Horizon National's market cap. While that's enough to warrant consideration, it doesn't really concern us.
The Bottom Line On First Horizon National's P/E Ratio
First Horizon National trades on a P/E ratio of 7.3, which is below the US market average of 15.1. The debt levels are not a major concern, but the lack of EPS growth is likely weighing on sentiment. Given First Horizon National's P/E ratio has declined from 11.9 to 7.3 in the last month, we know for sure that the market is more worried about the business today, than it was back then. For those who prefer to invest with the flow of momentum, that might be a bad sign, but for deep value investors this stock might justify some research.
When the market is wrong about a stock, it gives savvy investors an opportunity. If the reality for a company is not as bad as the P/E ratio indicates, then the share price should increase as the market realizes this. So this free visualization of the analyst consensus on future earnings could help you make the right decision about whether to buy, sell, or hold.
Of course you might be able to find a better stock than First Horizon National. So you may wish to see this free collection of other companies that have grown earnings strongly.
If you spot an error that warrants correction, please contact the editor at editorial-team@simplywallst.com. This article by Simply Wall St is general in nature. It does not constitute a recommendation to buy or sell any stock, and does not take account of your objectives, or your financial situation. Simply Wall St has no position in the stocks mentioned.
We aim to bring you long-term focused research analysis driven by fundamental data. Note that our analysis may not factor in the latest price-sensitive company announcements or qualitative material. Thank you for reading.
