
 Yahoo Finance
 How Does Exelixis's (NASDAQ:EXEL) P/E Compare To Its Industry, After Its Big Share Price Gain?

Exelixis (NASDAQ:EXEL) shares have had a really impressive month, gaining 60%, after some slippage. And the full year gain of 20% isn't too shabby, either!
All else being equal, a sharp share price increase should make a stock less attractive to potential investors. While the market sentiment towards a stock is very changeable, in the long run, the share price will tend to move in the same direction as earnings per share. The implication here is that deep value investors might steer clear when expectations of a company are too high. One way to gauge market expectations of a stock is to look at its Price to Earnings Ratio (PE Ratio). A high P/E implies that investors have high expectations of what a company can achieve compared to a company with a low P/E ratio.
Check out our latest analysis for Exelixis
Does Exelixis Have A Relatively High Or Low P/E For Its Industry?
Exelixis's P/E of 23.15 indicates some degree of optimism towards the stock. The image below shows that Exelixis has a higher P/E than the average (17.8) P/E for companies in the biotechs industry.
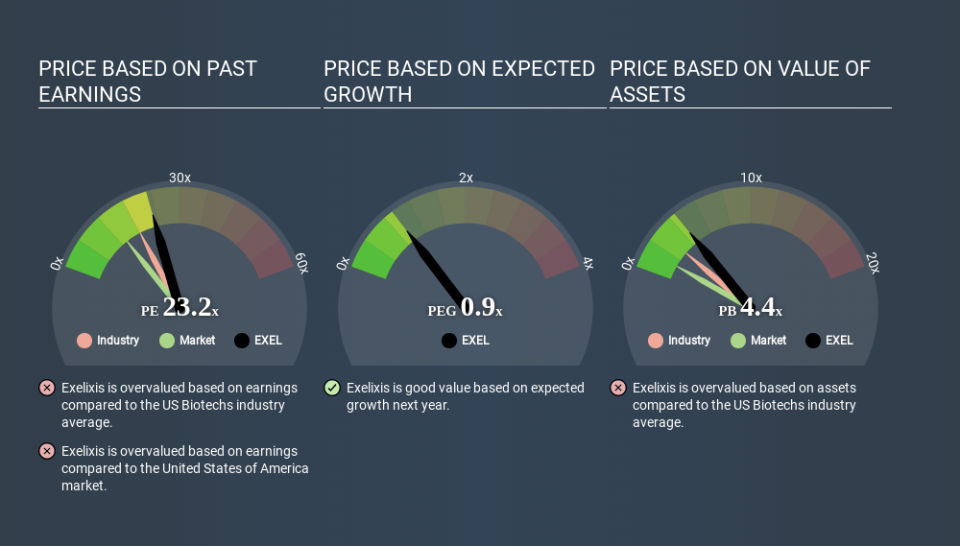
That means that the market expects Exelixis will outperform other companies in its industry. Clearly the market expects growth, but it isn't guaranteed. So investors should always consider the P/E ratio alongside other factors, such as whether company directors have been buying shares.
How Growth Rates Impact P/E Ratios
P/E ratios primarily reflect market expectations around earnings growth rates. That's because companies that grow earnings per share quickly will rapidly increase the 'E' in the equation. That means unless the share price increases, the P/E will reduce in a few years. And as that P/E ratio drops, the company will look cheap, unless its share price increases.
Exelixis saw earnings per share decrease by 54% last year.
Remember: P/E Ratios Don't Consider The Balance Sheet
Don't forget that the P/E ratio considers market capitalization. Thus, the metric does not reflect cash or debt held by the company. Hypothetically, a company could reduce its future P/E ratio by spending its cash (or taking on debt) to achieve higher earnings.
Such expenditure might be good or bad, in the long term, but the point here is that the balance sheet is not reflected by this ratio.
Exelixis's Balance Sheet
With net cash of US$852m, Exelixis has a very strong balance sheet, which may be important for its business. Having said that, at 11% of its market capitalization the cash hoard would contribute towards a higher P/E ratio.
The Bottom Line On Exelixis's P/E Ratio
Exelixis's P/E is 23.2 which is above average (13.3) in its market. The recent drop in earnings per share would make some investors cautious, but the net cash position means the company has time to improve: and the high P/E suggests the market thinks it will. What we know for sure is that investors have become much more excited about Exelixis recently, since they have pushed its P/E ratio from 14.5 to 23.2 over the last month. For those who prefer to invest with the flow of momentum, that might mean it's time to put the stock on a watchlist, or research it. But the contrarian may see it as a missed opportunity.
Investors have an opportunity when market expectations about a stock are wrong. If the reality for a company is better than it expects, you can make money by buying and holding for the long term. So this free visual report on analyst forecasts could hold the key to an excellent investment decision.
You might be able to find a better buy than Exelixis. If you want a selection of possible winners, check out this free list of interesting companies that trade on a P/E below 20 (but have proven they can grow earnings).
If you spot an error that warrants correction, please contact the editor at editorial-team@simplywallst.com. This article by Simply Wall St is general in nature. It does not constitute a recommendation to buy or sell any stock, and does not take account of your objectives, or your financial situation. Simply Wall St has no position in the stocks mentioned.
We aim to bring you long-term focused research analysis driven by fundamental data. Note that our analysis may not factor in the latest price-sensitive company announcements or qualitative material. Thank you for reading.
