
 Yahoo Finance
 Does Cooper Energy's (ASX:COE) Share Price Gain of 55% Match Its Business Performance?

By buying an index fund, investors can approximate the average market return. But if you buy good businesses at attractive prices, your portfolio returns could exceed the average market return. For example, the Cooper Energy Limited (ASX:COE) share price is up 55% in the last three years, clearly besting the market return of around 15% (not including dividends). On the other hand, the returns haven't been quite so good recently, with shareholders up just 16%.
See our latest analysis for Cooper Energy
Given that Cooper Energy didn't make a profit in the last twelve months, we'll focus on revenue growth to form a quick view of its business development. When a company doesn't make profits, we'd generally expect to see good revenue growth. That's because fast revenue growth can be easily extrapolated to forecast profits, often of considerable size.
Over the last three years Cooper Energy has grown its revenue at 44% annually. That's well above most pre-profit companies. The share price rise of 16% per year throughout that time is nice to see, and given the revenue growth, that gain seems somewhat justified. If that's the case, now might be the time to take a close look at Cooper Energy. A window of opportunity may reveal itself with time, if the business can trend to profitability.
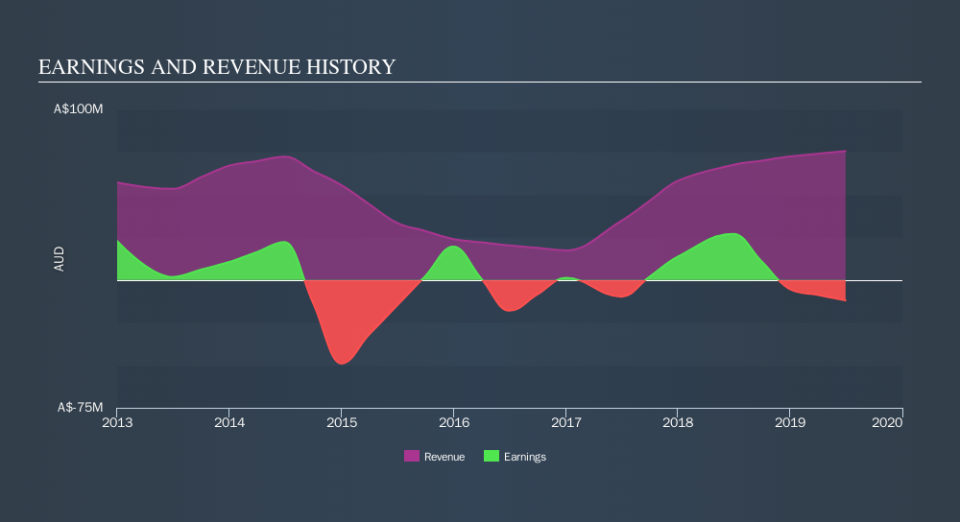
The graphic below depicts how earnings and revenue have changed over time (unveil the exact values by clicking on the image).
If you are thinking of buying or selling Cooper Energy stock, you should check out this FREE detailed report on its balance sheet.
What about the Total Shareholder Return (TSR)?
We've already covered Cooper Energy's share price action, but we should also mention its total shareholder return (TSR). The TSR is a return calculation that accounts for the value of cash dividends (assuming that any dividend received was reinvested) and the calculated value of any discounted capital raisings and spin-offs. Cooper Energy hasn't been paying dividends, but its TSR of 79% exceeds its share price return of 55%, implying it has either spun-off a business, or raised capital at a discount; thereby providing additional value to shareholders.
A Different Perspective
It's nice to see that Cooper Energy shareholders have received a total shareholder return of 16% over the last year. That gain is better than the annual TSR over five years, which is 8.6%. Therefore it seems like sentiment around the company has been positive lately. In the best case scenario, this may hint at some real business momentum, implying that now could be a great time to delve deeper. Before spending more time on Cooper Energy it might be wise to click here to see if insiders have been buying or selling shares.
If you like to buy stocks alongside management, then you might just love this free list of companies. (Hint: insiders have been buying them).
Please note, the market returns quoted in this article reflect the market weighted average returns of stocks that currently trade on AU exchanges.
We aim to bring you long-term focused research analysis driven by fundamental data. Note that our analysis may not factor in the latest price-sensitive company announcements or qualitative material.
If you spot an error that warrants correction, please contact the editor at editorial-team@simplywallst.com. This article by Simply Wall St is general in nature. It does not constitute a recommendation to buy or sell any stock, and does not take account of your objectives, or your financial situation. Simply Wall St has no position in the stocks mentioned. Thank you for reading.
