
 Yahoo Finance
 How Does Boston Scientific's (NYSE:BSX) P/E Compare To Its Industry, After The Share Price Drop?

Unfortunately for some shareholders, the Boston Scientific (NYSE:BSX) share price has dived 35% in the last thirty days. The recent drop has obliterated the annual return, with the share price now down 28% over that longer period.
Assuming nothing else has changed, a lower share price makes a stock more attractive to potential buyers. While the market sentiment towards a stock is very changeable, in the long run, the share price will tend to move in the same direction as earnings per share. The implication here is that long term investors have an opportunity when expectations of a company are too low. One way to gauge market expectations of a stock is to look at its Price to Earnings Ratio (PE Ratio). A high P/E ratio means that investors have a high expectation about future growth, while a low P/E ratio means they have low expectations about future growth.
Check out our latest analysis for Boston Scientific
How Does Boston Scientific's P/E Ratio Compare To Its Peers?
Boston Scientific's P/E of 8.16 indicates relatively low sentiment towards the stock. If you look at the image below, you can see Boston Scientific has a lower P/E than the average (32.7) in the medical equipment industry classification.
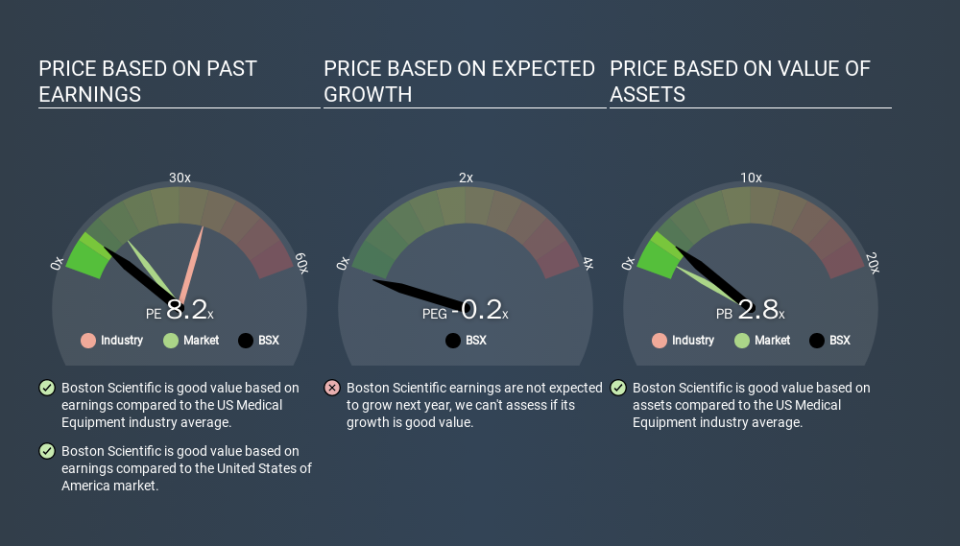
Its relatively low P/E ratio indicates that Boston Scientific shareholders think it will struggle to do as well as other companies in its industry classification. Since the market seems unimpressed with Boston Scientific, it's quite possible it could surprise on the upside. If you consider the stock interesting, further research is recommended. For example, I often monitor director buying and selling.
How Growth Rates Impact P/E Ratios
Earnings growth rates have a big influence on P/E ratios. That's because companies that grow earnings per share quickly will rapidly increase the 'E' in the equation. And in that case, the P/E ratio itself will drop rather quickly. So while a stock may look expensive based on past earnings, it could be cheap based on future earnings.
Boston Scientific's earnings made like a rocket, taking off 179% last year. And earnings per share have improved by 136% annually, over the last three years. So you might say it really deserves to have an above-average P/E ratio.
Don't Forget: The P/E Does Not Account For Debt or Bank Deposits
The 'Price' in P/E reflects the market capitalization of the company. That means it doesn't take debt or cash into account. The exact same company would hypothetically deserve a higher P/E ratio if it had a strong balance sheet, than if it had a weak one with lots of debt, because a cashed up company can spend on growth.
Such expenditure might be good or bad, in the long term, but the point here is that the balance sheet is not reflected by this ratio.
So What Does Boston Scientific's Balance Sheet Tell Us?
Boston Scientific's net debt equates to 25% of its market capitalization. While that's enough to warrant consideration, it doesn't really concern us.
The Verdict On Boston Scientific's P/E Ratio
Boston Scientific's P/E is 8.2 which is below average (12.7) in the US market. The company does have a little debt, and EPS growth was good last year. The low P/E ratio suggests current market expectations are muted, implying these levels of growth will not continue. What can be absolutely certain is that the market has become more pessimistic about Boston Scientific over the last month, with the P/E ratio falling from 12.5 back then to 8.2 today. For those who prefer invest in growth, this stock apparently offers limited promise, but the deep value investors may find the pessimism around this stock enticing.
Investors should be looking to buy stocks that the market is wrong about. As value investor Benjamin Graham famously said, 'In the short run, the market is a voting machine but in the long run, it is a weighing machine. So this free visualization of the analyst consensus on future earnings could help you make the right decision about whether to buy, sell, or hold.
Of course, you might find a fantastic investment by looking at a few good candidates. So take a peek at this free list of companies with modest (or no) debt, trading on a P/E below 20.
If you spot an error that warrants correction, please contact the editor at editorial-team@simplywallst.com. This article by Simply Wall St is general in nature. It does not constitute a recommendation to buy or sell any stock, and does not take account of your objectives, or your financial situation. Simply Wall St has no position in the stocks mentioned.
We aim to bring you long-term focused research analysis driven by fundamental data. Note that our analysis may not factor in the latest price-sensitive company announcements or qualitative material. Thank you for reading.
