
 Yahoo Finance
 What does Aurizon Holdings Limited’s (ASX:AZJ) Balance Sheet Tell Us About Its Future?

Small-cap and large-cap companies receive a lot of attention from investors, but mid-cap stocks like Aurizon Holdings Limited (ASX:AZJ), with a market cap of AU$8.9b, are often out of the spotlight. However, generally ignored mid-caps have historically delivered better risk-adjusted returns than the two other categories of stocks. Today we will look at AZJ’s financial liquidity and debt levels, which are strong indicators for whether the company can weather economic downturns or fund strategic acquisitions for future growth. Don’t forget that this is a general and concentrated examination of Aurizon Holdings’s financial health, so you should conduct further analysis into AZJ here.
View our latest analysis for Aurizon Holdings
Want to participate in a short research study? Help shape the future of investing tools and receive a $60 prize!
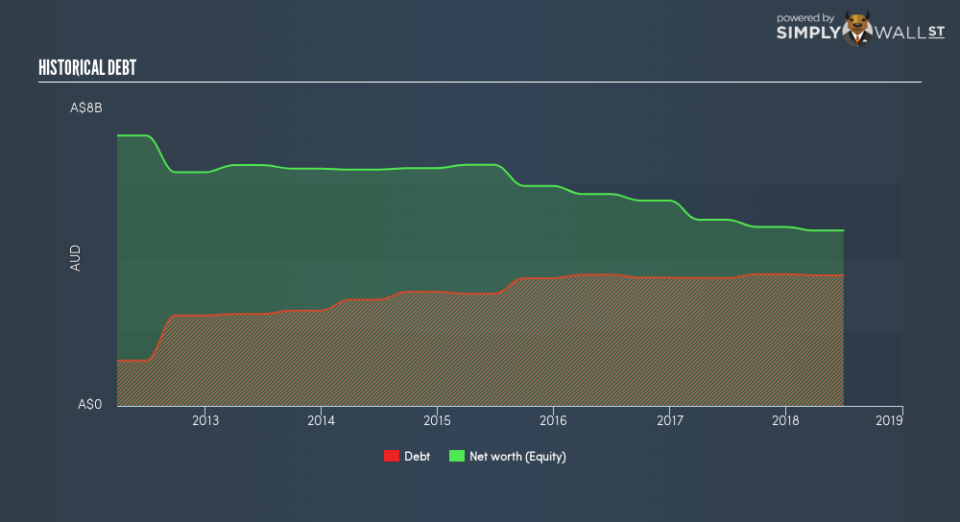
How does AZJ’s operating cash flow stack up against its debt?
AZJ’s debt level has been constant at around AU$3.5b over the previous year which accounts for long term debt. At this stable level of debt, AZJ currently has AU$35m remaining in cash and short-term investments for investing into the business. Moreover, AZJ has generated cash from operations of AU$1.3b during the same period of time, leading to an operating cash to total debt ratio of 36%, meaning that AZJ’s debt is appropriately covered by operating cash. This ratio can also be interpreted as a measure of efficiency as an alternative to return on assets. In AZJ’s case, it is able to generate 0.36x cash from its debt capital.
Can AZJ meet its short-term obligations with the cash in hand?
At the current liabilities level of AU$840m, it appears that the company arguably has a rather low level of current assets relative its obligations, with the current ratio last standing at 0.95x.
Can AZJ service its debt comfortably?
AZJ is a relatively highly levered company with a debt-to-equity of 74%. This is not unusual for mid-caps as debt tends to be a cheaper and faster source of funding for some businesses. No matter how high the company’s debt, if it can easily cover the interest payments, it’s considered to be efficient with its use of excess leverage. A company generating earnings after interest and tax at least three times its net interest payments is considered financially sound. In AZJ’s case, the ratio of 6.17x suggests that interest is appropriately covered, which means that lenders may be inclined to lend more money to the company, as it is seen as safe in terms of payback.
Next Steps:
Although AZJ’s debt level is towards the higher end of the spectrum, its cash flow coverage seems adequate to meet debt obligations which means its debt is being efficiently utilised. Though its lack of liquidity raises questions over current asset management practices for the mid-cap. I admit this is a fairly basic analysis for AZJ’s financial health. Other important fundamentals need to be considered alongside. You should continue to research Aurizon Holdings to get a more holistic view of the stock by looking at:
Future Outlook: What are well-informed industry analysts predicting for AZJ’s future growth? Take a look at our free research report of analyst consensus for AZJ’s outlook.
Valuation: What is AZJ worth today? Is the stock undervalued, even when its growth outlook is factored into its intrinsic value? The intrinsic value infographic in our free research report helps visualize whether AZJ is currently mispriced by the market.
Other High-Performing Stocks: Are there other stocks that provide better prospects with proven track records? Explore our free list of these great stocks here.
To help readers see past the short term volatility of the financial market, we aim to bring you a long-term focused research analysis purely driven by fundamental data. Note that our analysis does not factor in the latest price-sensitive company announcements.
The author is an independent contributor and at the time of publication had no position in the stocks mentioned. For errors that warrant correction please contact the editor at editorial-team@simplywallst.com.
