
 Yahoo Finance
 What does Atlas Pearls Ltd’s (ASX:ATP) Balance Sheet Tell Us About Its Future?

Atlas Pearls Ltd (ASX:ATP) is a small-cap stock with a market capitalization of AU$7.1m. While investors primarily focus on the growth potential and competitive landscape of the small-cap companies, they end up ignoring a key aspect, which could be the biggest threat to its existence: its financial health. Why is it important? Since ATP is loss-making right now, it’s vital to evaluate the current state of its operations and pathway to profitability. Here are few basic financial health checks you should consider before taking the plunge. However, I know these factors are very high-level, so I suggest you dig deeper yourself into ATP here.
Does ATP produce enough cash relative to debt?
ATP’s debt levels surged from AU$3.5m to AU$4.1m over the last 12 months , which accounts for long term debt. With this increase in debt, ATP’s cash and short-term investments stands at AU$1.3m for investing into the business. Moving onto cash from operations, its trivial cash flows from operations make the cash-to-debt ratio less useful to us, though these low levels of cash means that operational efficiency is worth a look. For this article’s sake, I won’t be looking at this today, but you can assess some of ATP’s operating efficiency ratios such as ROA here.
Can ATP pay its short-term liabilities?
At the current liabilities level of AU$4.7m, it seems that the business has been able to meet these commitments with a current assets level of AU$13m, leading to a 2.82x current account ratio. Usually, for Luxury companies, this is a suitable ratio since there’s a sufficient cash cushion without leaving too much capital idle or in low-earning investments.
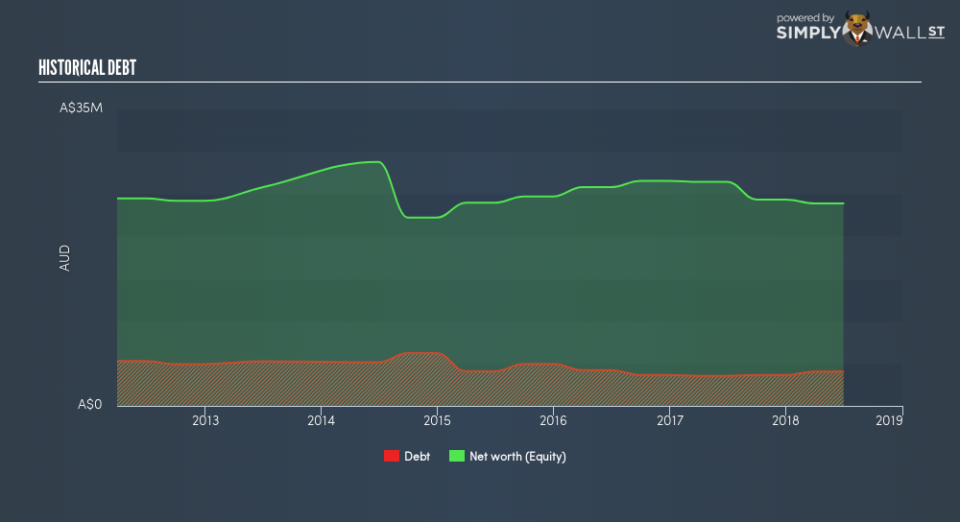
Is ATP’s debt level acceptable?
With a debt-to-equity ratio of 17%, ATP’s debt level may be seen as prudent. ATP is not taking on too much debt commitment, which can be restrictive and risky for equity-holders. Investors’ risk associated with debt is very low with ATP, and the company has plenty of headroom and ability to raise debt should it need to in the future.
Next Steps:
ATP’s high cash coverage and low debt levels indicate its ability to utilise its borrowings efficiently in order to generate ample cash flow. Furthermore, the company exhibits an ability to meet its near term obligations should an adverse event occur. I admit this is a fairly basic analysis for ATP’s financial health. Other important fundamentals need to be considered alongside. I suggest you continue to research Atlas Pearls to get a more holistic view of the stock by looking at:
Historical Performance: What has ATP’s returns been like over the past? Go into more detail in the past track record analysis and take a look at the free visual representations of our analysis for more clarity.
Other High-Performing Stocks: Are there other stocks that provide better prospects with proven track records? Explore our free list of these great stocks here.
To help readers see past the short term volatility of the financial market, we aim to bring you a long-term focused research analysis purely driven by fundamental data. Note that our analysis does not factor in the latest price-sensitive company announcements.
The author is an independent contributor and at the time of publication had no position in the stocks mentioned. For errors that warrant correction please contact the editor at editorial-team@simplywallst.com.
