
 Yahoo Finance
 Does Link Administration Holdings Limited’s (ASX:LNK) CEO Pay Matter?

John McMurtrie became the CEO of Link Administration Holdings Limited (ASX:LNK) in 2002. First, this article will compare CEO compensation with compensation at similar sized companies. After that, we will consider the growth in the business. And finally – as a second measure of performance – we will look at the returns shareholders have received over the last few years. The aim of all this is to consider the appropriateness of CEO pay levels.
View our latest analysis for Link Administration Holdings
Want to help shape the future of investing tools and platforms? Take the survey and be part of one of the most advanced studies of stock market investors to date.
How Does John McMurtrie’s Compensation Compare With Similar Sized Companies?
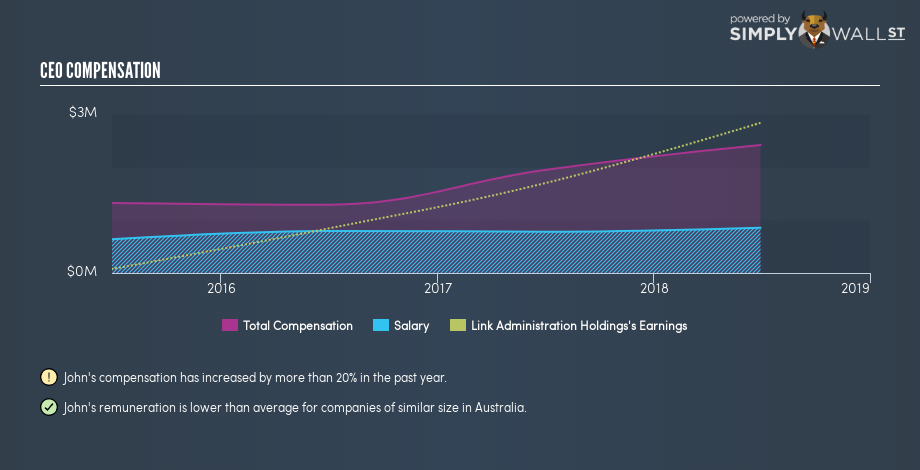
At the time of writing our data says that Link Administration Holdings Limited has a market cap of AU$3.6b, and is paying total annual CEO compensation of AU$2.4m. (This figure is for the year to 2018). While we always look at total compensation first, we note that the salary component is less, at AU$855k. As part of our analysis we looked at companies in the same jurisdiction, with market capitalizations of AU$2.8b to AU$8.9b. The median total CEO compensation was AU$3.9m.
This would give shareholders a good impression of the company, since most similar size companies have to pay more, leaving less for shareholders. However, before we heap on the praise, we should delve deeper to understand business performance.
You can see a visual representation of the CEO compensation at Link Administration Holdings, below.
Is Link Administration Holdings Limited Growing?
Over the last three years Link Administration Holdings Limited has grown its earnings per share (EPS) by an average of 64% per year (using a line of best fit). Its revenue is up 54% over last year.
This demonstrates that the company has been improving recently. A good result. The combination of strong revenue growth with medium-term earnings per share improvement certainly points to the kind of growth I like to see.
It could be important to check this free visual depiction of what analysts expect for the future.
Has Link Administration Holdings Limited Been A Good Investment?
Link Administration Holdings Limited has not done too badly by shareholders, with a total return of 3.1%, over three years. But they probably wouldn’t be so happy as to think the CEO should be paid more than is normal, for companies around this size.
In Summary…
It looks like Link Administration Holdings Limited pays its CEO less than similar sized companies. Since the business is growing, many would argue this suggests the pay is modest. While some might be keen on seeing higher returns, our short analysis has not produced any evidence to suggest John McMurtrie is overcompensated.
Few would complain about reasonable CEO remuneration when the business is growing earnings per share. It would be an additional positive if insiders are buying shares. Shareholders may want to check for free if Link Administration Holdings insiders are buying or selling shares.
Or you could feast your eyes on this interactive graph depicting past earnings, cash flow and revenue.
To help readers see past the short term volatility of the financial market, we aim to bring you a long-term focused research analysis purely driven by fundamental data. Note that our analysis does not factor in the latest price-sensitive company announcements.
The author is an independent contributor and at the time of publication had no position in the stocks mentioned. For errors that warrant correction please contact the editor at editorial-team@simplywallst.com.
