
 Yahoo Finance
 Do Directors Own Tinybeans Group Limited (ASX:TNY) Shares?

Every investor in Tinybeans Group Limited (ASX:TNY) should be aware of the most powerful shareholder groups. Institutions often own shares in more established companies, while it’s not unusual to see insiders own a fair bit of smaller companies. Warren Buffett said that he likes ‘a business with enduring competitive advantages that is run by able and owner-oriented people’. So it’s nice to see some insider ownership, because it may suggest that management is owner-oriented.
Tinybeans Group is not a large company by global standards. It has a market capitalization of AU$12m, which means it wouldn’t have the attention of many institutional investors. In the chart below below, we can see that institutions don’t own many shares in the company. Let’s take a closer look to see what the different types of shareholder can tell us about TNY.
Check out our latest analysis for Tinybeans Group
What Does The Institutional Ownership Tell Us About Tinybeans Group?
Many institutions measure their performance against an index that approximates the local market. So they usually pay more attention to companies that are included in major indices.
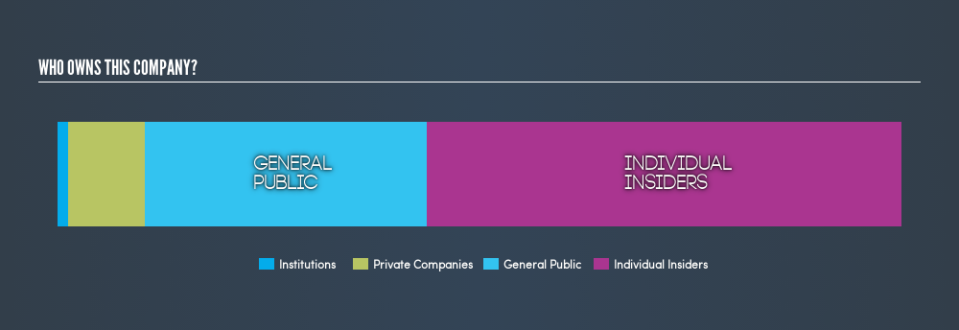
Institutions own less than 5% of Tinybeans Group. That indicates that the company is on the radar of some funds, but it isn’t particularly popular with professional investors at the moment. So if the company itself can improve over time, we may well see more institutional buyers in the future. When multiple institutional investors want to buy shares, we often see a rising share price. The past revenue trajectory (shown below) can be an indication of future growth, but there are no guarantees.

We note that hedge funds don’t have a meaningful investment in Tinybeans Group. As far I can tell there isn’t analyst coverage of the company, so it is probably flying under the radar.
Insider Ownership Of Tinybeans Group
The definition of an insider can differ slightly between different countries, but members of the board of directors always count. Company management run the business, but the CEO will answer to the board, even if he or she is a member of it.
Insider ownership is positive when it signals leadership are thinking like the true owners of the company. However, high insider ownership can also give immense power to a small group within the company. This can be negative in some circumstances.
It seems that insiders own more than half the Tinybeans Group Limited stock. This gives them a lot of power. That means they own AU$6.5m worth of shares in the AU$12m company. That’s quite meaningful. Most would argue this is a positive, showing strong alignment with shareholders. You can click here to see if those insiders have been buying or selling.
General Public Ownership
The general public, with a 33% stake in the company, will not easily be ignored. While this group can’t necessarily call the shots, it can certainly have a real influence on how the company is run.
Private Company Ownership
It seems that Private Companies own 9.1%, of the TNY stock. It might be worth looking deeper into this. If related parties, such as insiders, have an interest in one of these private companies, that should be disclosed in the annual report. Private companies may also have a strategic interest in the company.
Next Steps:
While it is well worth considering the different groups that own a company, there are other factors that are even more important.
I always like to check for a history of revenue growth. You can too, by accessing this free chart of historic revenue and earnings in this detailed graph.
Of course, you might find a fantastic investment by looking elsewhere. So take a peek at this free list of interesting companies.
NB: Figures in this article are calculated using data from the last twelve months, which refer to the 12-month period ending on the last date of the month the financial statement is dated. This may not be consistent with full year annual report figures.
We aim to bring you long-term focused research analysis driven by fundamental data. Note that our analysis may not factor in the latest price-sensitive company announcements or qualitative material.
If you spot an error that warrants correction, please contact the editor at editorial-team@simplywallst.com. This article by Simply Wall St is general in nature. It does not constitute a recommendation to buy or sell any stock, and does not take account of your objectives, or your financial situation. Simply Wall St has no position in the stocks mentioned. Thank you for reading.
