
 Yahoo Finance
 Do Directors Own Monadelphous Group Limited (ASX:MND) Shares?

A look at the shareholders of Monadelphous Group Limited (ASX:MND) can tell us which group is most powerful. Large companies usually have institutions as shareholders, and we usually see insiders owning shares in smaller companies. Companies that used to be publicly owned tend to have lower insider ownership.
With a market capitalization of AU$1.4b, Monadelphous Group is a decent size, so it is probably on the radar of institutional investors. In the chart below below, we can see that institutional investors have bought into the company. Let's delve deeper into each type of owner, to discover more about MND.
See our latest analysis for Monadelphous Group
What Does The Institutional Ownership Tell Us About Monadelphous Group?
Many institutions measure their performance against an index that approximates the local market. So they usually pay more attention to companies that are included in major indices.
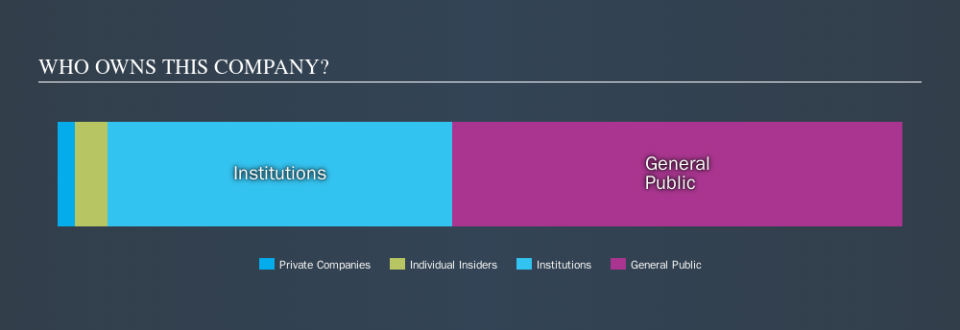
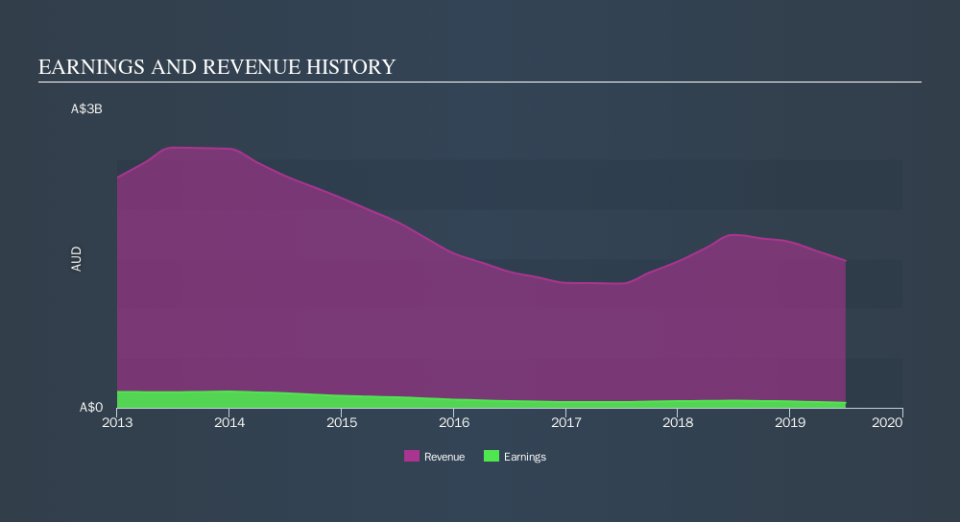
Monadelphous Group already has institutions on the share registry. Indeed, they own 41% of the company. This can indicate that the company has a certain degree of credibility in the investment community. However, it is best to be wary of relying on the supposed validation that comes with institutional investors. They too, get it wrong sometimes. It is not uncommon to see a big share price drop if two large institutional investors try to sell out of a stock at the same time. So it is worth checking the past earnings trajectory of Monadelphous Group, (below). Of course, keep in mind that there are other factors to consider, too.
Monadelphous Group is not owned by hedge funds. Quite a few analysts cover the stock, so you could look into forecast growth quite easily.
Insider Ownership Of Monadelphous Group
The definition of company insiders can be subjective, and does vary between jurisdictions. Our data reflects individual insiders, capturing board members at the very least. Company management run the business, but the CEO will answer to the board, even if he or she is a member of it.
I generally consider insider ownership to be a good thing. However, on some occasions it makes it more difficult for other shareholders to hold the board accountable for decisions.
I can report that insiders do own shares in Monadelphous Group Limited. As individuals, the insiders collectively own AU$54m worth of the AU$1.4b company. It is good to see some investment by insiders, but it might be worth checking if those insiders have been buying.
General Public Ownership
The general public, who are mostly retail investors, collectively hold 53% of Monadelphous Group shares. This size of ownership gives retail investors collective power. They can and probably do influence decisions on executive compensation, dividend policies and proposed business acquisitions.
Next Steps:
It's always worth thinking about the different groups who own shares in a company. But to understand Monadelphous Group better, we need to consider many other factors.
Many find it useful to take an in depth look at how a company has performed in the past. You can access this detailed graph of past earnings, revenue and cash flow.
If you would prefer discover what analysts are predicting in terms of future growth, do not miss this free report on analyst forecasts.
NB: Figures in this article are calculated using data from the last twelve months, which refer to the 12-month period ending on the last date of the month the financial statement is dated. This may not be consistent with full year annual report figures.
We aim to bring you long-term focused research analysis driven by fundamental data. Note that our analysis may not factor in the latest price-sensitive company announcements or qualitative material.
If you spot an error that warrants correction, please contact the editor at editorial-team@simplywallst.com. This article by Simply Wall St is general in nature. It does not constitute a recommendation to buy or sell any stock, and does not take account of your objectives, or your financial situation. Simply Wall St has no position in the stocks mentioned. Thank you for reading.
