
 Yahoo Finance
 Did You Miss Assured Guaranty's (NYSE:AGO) 84% Share Price Gain?
Passive investing in index funds can generate returns that roughly match the overall market. But you can significantly boost your returns by picking above-average stocks. To wit, the Assured Guaranty Ltd. (NYSE:AGO) share price is 84% higher than it was a year ago, much better than the market return of around 43% (not including dividends) in the same period. If it can keep that out-performance up over the long term, investors will do very well! Also impressive, the stock is up 32% over three years, making long term shareholders happy, too.
View our latest analysis for Assured Guaranty
There is no denying that markets are sometimes efficient, but prices do not always reflect underlying business performance. One way to examine how market sentiment has changed over time is to look at the interaction between a company's share price and its earnings per share (EPS).
Assured Guaranty was able to grow EPS by 73% in the last twelve months. This EPS growth is reasonably close to the 84% increase in the share price. That suggests that the market sentiment around the company hasn't changed much over that time. It makes intuitive sense that the share price and EPS would grow at similar rates.
The graphic below depicts how EPS has changed over time (unveil the exact values by clicking on the image).
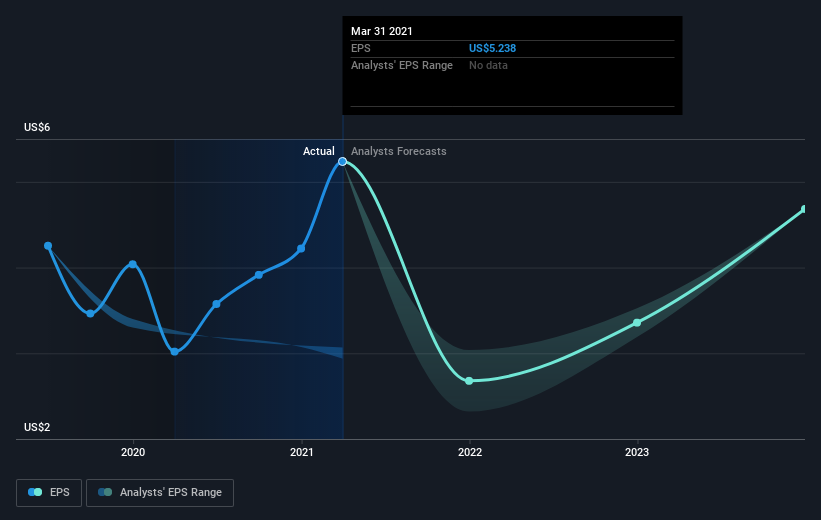
We know that Assured Guaranty has improved its bottom line lately, but is it going to grow revenue? If you're interested, you could check this free report showing consensus revenue forecasts.
What About Dividends?
As well as measuring the share price return, investors should also consider the total shareholder return (TSR). Whereas the share price return only reflects the change in the share price, the TSR includes the value of dividends (assuming they were reinvested) and the benefit of any discounted capital raising or spin-off. Arguably, the TSR gives a more comprehensive picture of the return generated by a stock. As it happens, Assured Guaranty's TSR for the last year was 88%, which exceeds the share price return mentioned earlier. This is largely a result of its dividend payments!
A Different Perspective
We're pleased to report that Assured Guaranty shareholders have received a total shareholder return of 88% over one year. Of course, that includes the dividend. That gain is better than the annual TSR over five years, which is 14%. Therefore it seems like sentiment around the company has been positive lately. Given the share price momentum remains strong, it might be worth taking a closer look at the stock, lest you miss an opportunity. While it is well worth considering the different impacts that market conditions can have on the share price, there are other factors that are even more important. Like risks, for instance. Every company has them, and we've spotted 3 warning signs for Assured Guaranty (of which 2 are significant!) you should know about.
If you are like me, then you will not want to miss this free list of growing companies that insiders are buying.
Please note, the market returns quoted in this article reflect the market weighted average returns of stocks that currently trade on US exchanges.
This article by Simply Wall St is general in nature. It does not constitute a recommendation to buy or sell any stock, and does not take account of your objectives, or your financial situation. We aim to bring you long-term focused analysis driven by fundamental data. Note that our analysis may not factor in the latest price-sensitive company announcements or qualitative material. Simply Wall St has no position in any stocks mentioned.
Have feedback on this article? Concerned about the content? Get in touch with us directly. Alternatively, email editorial-team (at) simplywallst.com.
