
 Yahoo Finance
 Did You Manage To Avoid MGM China Holdings's (HKG:2282) Painful 54% Share Price Drop?

Want to participate in a short research study? Help shape the future of investing tools and you could win a $250 gift card!
Ideally, your overall portfolio should beat the market average. But the main game is to find enough winners to more than offset the losers So we wouldn't blame long term MGM China Holdings Limited (HKG:2282) shareholders for doubting their decision to hold, with the stock down 54% over a half decade. And it's not just long term holders hurting, because the stock is down 46% in the last year. Furthermore, it's down 27% in about a quarter. That's not much fun for holders.
View our latest analysis for MGM China Holdings
In his essay The Superinvestors of Graham-and-Doddsville Warren Buffett described how share prices do not always rationally reflect the value of a business. One flawed but reasonable way to assess how sentiment around a company has changed is to compare the earnings per share (EPS) with the share price.
During the five years over which the share price declined, MGM China Holdings's earnings per share (EPS) dropped by 27% each year. This fall in the EPS is worse than the 14% compound annual share price fall. So the market may previously have expected a drop, or else it expects the situation will improve.
The graphic below depicts how EPS has changed over time (unveil the exact values by clicking on the image).
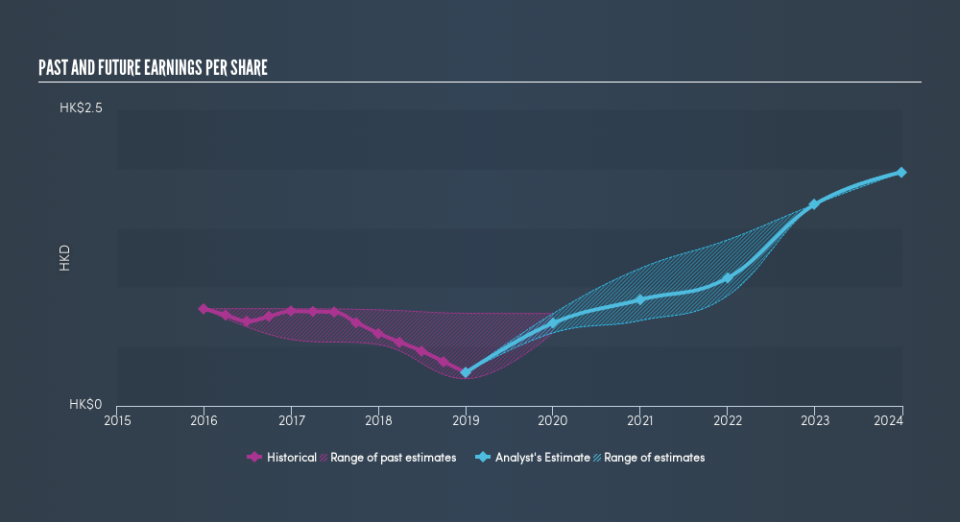
It might be well worthwhile taking a look at our free report on MGM China Holdings's earnings, revenue and cash flow.
What About Dividends?
It is important to consider the total shareholder return, as well as the share price return, for any given stock. The TSR is a return calculation that accounts for the value of cash dividends (assuming that any dividend received was reinvested) and the calculated value of any discounted capital raisings and spin-offs. So for companies that pay a generous dividend, the TSR is often a lot higher than the share price return. As it happens, MGM China Holdings's TSR for the last 5 years was -48%, which exceeds the share price return mentioned earlier. The dividends paid by the company have thusly boosted the total shareholder return.
A Different Perspective
While the broader market lost about 13% in the twelve months, MGM China Holdings shareholders did even worse, losing 46% (even including dividends). Having said that, it's inevitable that some stocks will be oversold in a falling market. The key is to keep your eyes on the fundamental developments. Unfortunately, last year's performance may indicate unresolved challenges, given that it was worse than the annualised loss of 12% over the last half decade. We realise that Buffett has said investors should 'buy when there is blood on the streets', but we caution that investors should first be sure they are buying a high quality businesses. Is MGM China Holdings cheap compared to other companies? These 3 valuation measures might help you decide.
If you are like me, then you will not want to miss this free list of growing companies that insiders are buying.
Please note, the market returns quoted in this article reflect the market weighted average returns of stocks that currently trade on HK exchanges.
We aim to bring you long-term focused research analysis driven by fundamental data. Note that our analysis may not factor in the latest price-sensitive company announcements or qualitative material.
If you spot an error that warrants correction, please contact the editor at editorial-team@simplywallst.com. This article by Simply Wall St is general in nature. It does not constitute a recommendation to buy or sell any stock, and does not take account of your objectives, or your financial situation. Simply Wall St has no position in the stocks mentioned. Thank you for reading.
