
 Yahoo Finance
 Did Excelsior Capital’s (ASX:ECL) Share Price Deserve to Gain 36%?

One simple way to benefit from the stock market is to buy an index fund. But if you pick the right individual stocks, you could make more than that. Just take a look at Excelsior Capital Limited (ASX:ECL), which is up 36%, over three years, soundly beating the market return of 22% (not including dividends). On the other hand, the returns haven’t been quite so good recently, with shareholders up just 7.3%, including dividends.
See our latest analysis for Excelsior Capital
To quote Buffett, ‘Ships will sail around the world but the Flat Earth Society will flourish. There will continue to be wide discrepancies between price and value in the marketplace…’ By comparing earnings per share (EPS) and share price changes over time, we can get a feel for how investor attitudes to a company have morphed over time.
Over the last three years, Excelsior Capital failed to grow earnings per share, which fell 3.2% (annualized). Companies are not always focussed on EPS growth in the short term, and looking at how the share price has reacted, we don’t think EPS is the most important metric for Excelsior Capital at the moment. Since the change in EPS doesn’t seem to correlate with the change in share price, it’s worth taking a look at other metrics.
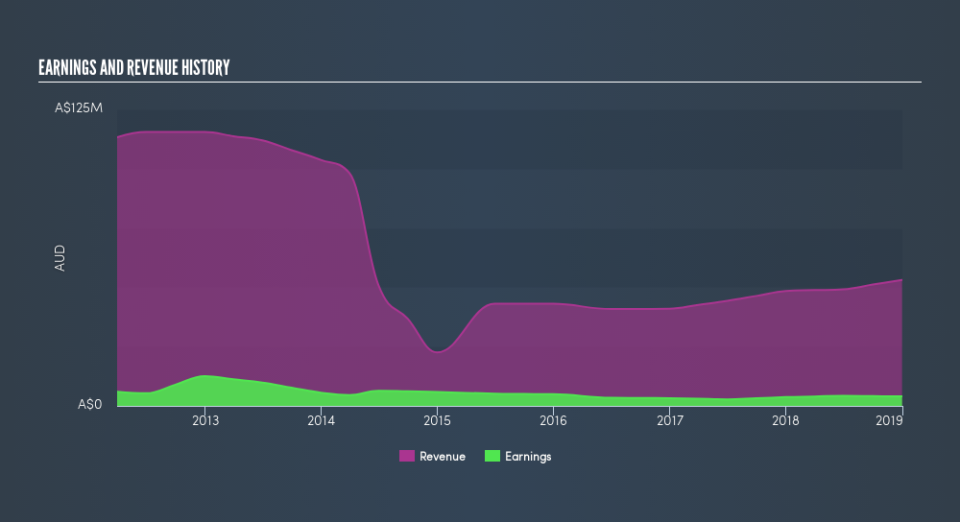
We doubt the dividend payments explain the share price rise, since we don’t see any improvement in that regard. But it’s far more plausible that the revenue growth of 9.2% per year is viewed as evidence that Excelsior Capital is growing. In that case, the revenue growth might be more important to shareholders, for now, thus justifying a higer share price.
Depicted in the graphic below, you’ll see revenue and earnings over time. If you want more detail, you can click on the chart itself.
We like that insiders have been buying shares in the last twelve months. Even so, future earnings will be far more important to whether current shareholders make money. Dive deeper into the earnings by checking this interactive graph of Excelsior Capital’s earnings, revenue and cash flow.
What About Dividends?
It is important to consider the total shareholder return, as well as the share price return, for any given stock. The TSR incorporates the value of any discounted capital raisings, along with any dividends, based on the assumption that the dividends are reinvested. It’s fair to say that the TSR gives a more complete picture for stocks that pay a dividend. We note that for Excelsior Capital the TSR over the last 3 years was 58%, which is better than the share price return mentioned above. And there’s no prize for guessing that the dividend payments largely explain the divergence!
A Different Perspective
Excelsior Capital shareholders gained a total return of 7.3% during the year. Unfortunately this falls short of the market return. If we look back over five years, the returns are even better, coming in at 9.8% per year for five years. It’s quite possible the business continues to execute with prowess, even as the share price gains are slowing. Investors who like to make money usually check up on insider purchases, such as the price paid, and total amount bought. You can find out about the insider purchases of Excelsior Capital by clicking this link.
There are plenty of other companies that have insiders buying up shares. You probably do not want to miss this free list of growing companies that insiders are buying.
Please note, the market returns quoted in this article reflect the market weighted average returns of stocks that currently trade on AU exchanges.
We aim to bring you long-term focused research analysis driven by fundamental data. Note that our analysis may not factor in the latest price-sensitive company announcements or qualitative material.
If you spot an error that warrants correction, please contact the editor at editorial-team@simplywallst.com. This article by Simply Wall St is general in nature. It does not constitute a recommendation to buy or sell any stock, and does not take account of your objectives, or your financial situation. Simply Wall St has no position in the stocks mentioned. Thank you for reading.
