
 Yahoo Finance
 Did Changing Sentiment Drive PAS Group's (ASX:PGR) Share Price Down A Painful 88%?

Want to participate in a short research study? Help shape the future of investing tools and you could win a $250 gift card!
Some stocks are best avoided. We really hate to see fellow investors lose their hard-earned money. Spare a thought for those who held The PAS Group Limited (ASX:PGR) for five whole years - as the share price tanked 88%. And some of the more recent buyers are probably worried, too, with the stock falling 62% in the last year. Shareholders have had an even rougher run lately, with the share price down 50% in the last 90 days.
While a drop like that is definitely a body blow, money isn't as important as health and happiness.
View our latest analysis for PAS Group
In his essay The Superinvestors of Graham-and-Doddsville Warren Buffett described how share prices do not always rationally reflect the value of a business. One way to examine how market sentiment has changed over time is to look at the interaction between a company's share price and its earnings per share (EPS).
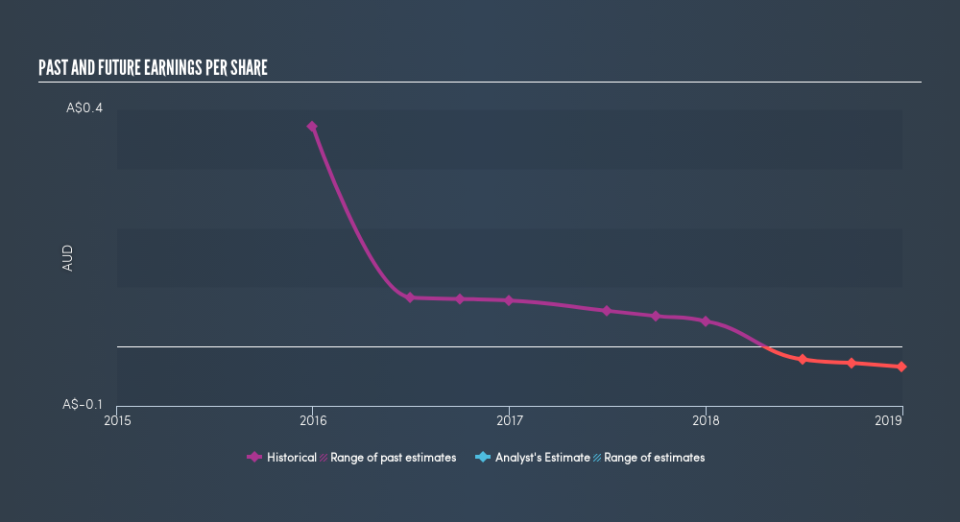
Over five years PAS Group's earnings per share dropped significantly, falling to a loss, with the share price also lower. At present it's hard to make valid comparisons between EPS and the share price. However, we can say we'd expect to see a falling share price in this scenario.
The company's earnings per share (over time) is depicted in the image below (click to see the exact numbers).
Dive deeper into PAS Group's key metrics by checking this interactive graph of PAS Group's earnings, revenue and cash flow.
A Dividend Lost
It's important to keep in mind that we've been talking about the share price returns, which don't include dividends, while the total shareholder return does. By accounting for the value of dividends paid, the TSR can be seen as a more complete measure of the value a company brings to its shareholders. PAS Group's TSR over the last 5 years is -84%; better than its share price return. Even though the company isn't paying dividends at the moment, it has done in the past.
A Different Perspective
PAS Group shareholders are down 62% for the year, but the market itself is up 12%. Even the share prices of good stocks drop sometimes, but we want to see improvements in the fundamental metrics of a business, before getting too interested. Unfortunately, last year's performance may indicate unresolved challenges, given that it was worse than the annualised loss of 31% over the last half decade. Generally speaking long term share price weakness can be a bad sign, though contrarian investors might want to research the stock in hope of a turnaround. Shareholders might want to examine this detailed historical graph of past earnings, revenue and cash flow.
For those who like to find winning investments this free list of growing companies with recent insider purchasing, could be just the ticket.
Please note, the market returns quoted in this article reflect the market weighted average returns of stocks that currently trade on AU exchanges.
We aim to bring you long-term focused research analysis driven by fundamental data. Note that our analysis may not factor in the latest price-sensitive company announcements or qualitative material.
If you spot an error that warrants correction, please contact the editor at editorial-team@simplywallst.com. This article by Simply Wall St is general in nature. It does not constitute a recommendation to buy or sell any stock, and does not take account of your objectives, or your financial situation. Simply Wall St has no position in the stocks mentioned. Thank you for reading.
