
 Yahoo Finance
 Did Changing Sentiment Drive International Business Machines's (NYSE:IBM) Share Price Down By 21%?

In order to justify the effort of selecting individual stocks, it's worth striving to beat the returns from a market index fund. But the risk of stock picking is that you will likely buy under-performing companies. Unfortunately, that's been the case for longer term International Business Machines Corporation (NYSE:IBM) shareholders, since the share price is down 21% in the last three years, falling well short of the market return of around 50%. The silver lining is that the stock is up 1.6% in about a week.
View our latest analysis for International Business Machines
To paraphrase Benjamin Graham: Over the short term the market is a voting machine, but over the long term it's a weighing machine. One imperfect but simple way to consider how the market perception of a company has shifted is to compare the change in the earnings per share (EPS) with the share price movement.
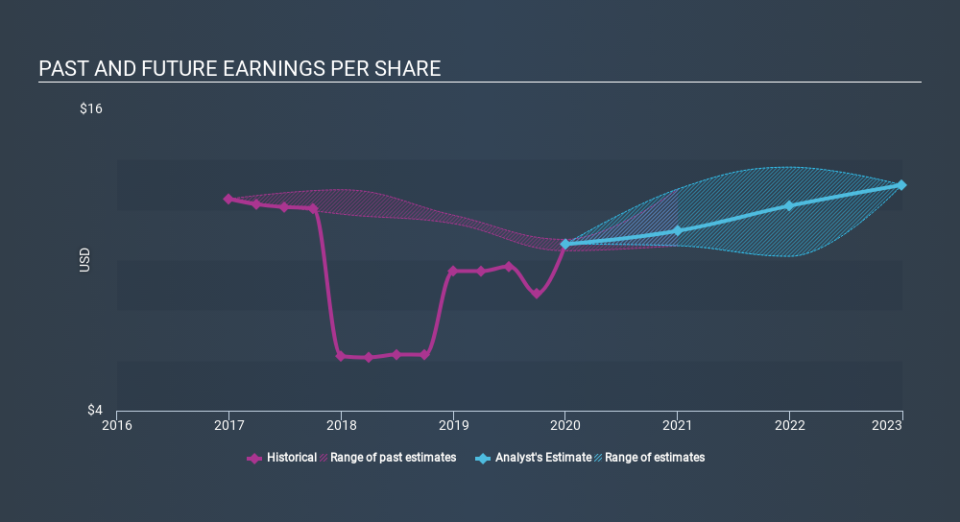
International Business Machines saw its EPS decline at a compound rate of 5.1% per year, over the last three years. The share price decline of 7.4% is actually steeper than the EPS slippage. So it's likely that the EPS decline has disappointed the market, leaving investors hesitant to buy.
You can see how EPS has changed over time in the image below (click on the chart to see the exact values).
We know that International Business Machines has improved its bottom line lately, but is it going to grow revenue? This free report showing analyst revenue forecasts should help you figure out if the EPS growth can be sustained.
What About Dividends?
When looking at investment returns, it is important to consider the difference between total shareholder return (TSR) and share price return. Whereas the share price return only reflects the change in the share price, the TSR includes the value of dividends (assuming they were reinvested) and the benefit of any discounted capital raising or spin-off. It's fair to say that the TSR gives a more complete picture for stocks that pay a dividend. In the case of International Business Machines, it has a TSR of -9.8% for the last 3 years. That exceeds its share price return that we previously mentioned. And there's no prize for guessing that the dividend payments largely explain the divergence!
A Different Perspective
International Business Machines shareholders are up 10.0% for the year (even including dividends) . Unfortunately this falls short of the market return. On the bright side, that's still a gain, and it's actually better than the average return of 2.3% over half a decade This suggests the company might be improving over time. While it is well worth considering the different impacts that market conditions can have on the share price, there are other factors that are even more important. Be aware that International Business Machines is showing 1 warning sign in our investment analysis , you should know about...
We will like International Business Machines better if we see some big insider buys. While we wait, check out this free list of growing companies with considerable, recent, insider buying.
Please note, the market returns quoted in this article reflect the market weighted average returns of stocks that currently trade on US exchanges.
If you spot an error that warrants correction, please contact the editor at editorial-team@simplywallst.com. This article by Simply Wall St is general in nature. It does not constitute a recommendation to buy or sell any stock, and does not take account of your objectives, or your financial situation. Simply Wall St has no position in the stocks mentioned.
We aim to bring you long-term focused research analysis driven by fundamental data. Note that our analysis may not factor in the latest price-sensitive company announcements or qualitative material. Thank you for reading.
