
 Yahoo Finance
 Did Changing Sentiment Drive AJ Lucas Group's (ASX:AJL) Share Price Down A Painful 92%?

Long term investing is the way to go, but that doesn't mean you should hold every stock forever. It hits us in the gut when we see fellow investors suffer a loss. Spare a thought for those who held AJ Lucas Group Limited (ASX:AJL) for five whole years - as the share price tanked 92%. We also note that the stock has performed poorly over the last year, with the share price down 77%. Shareholders have had an even rougher run lately, with the share price down 48% in the last 90 days.
We really hope anyone holding through that price crash has a diversified portfolio. Even when you lose money, you don't have to lose the lesson.
Check out our latest analysis for AJ Lucas Group
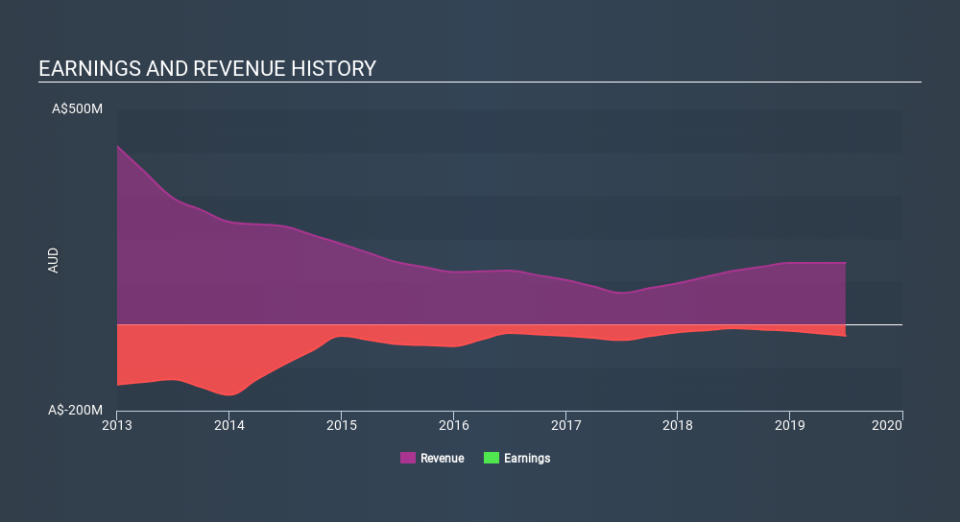
Given that AJ Lucas Group didn't make a profit in the last twelve months, we'll focus on revenue growth to form a quick view of its business development. Shareholders of unprofitable companies usually expect strong revenue growth. Some companies are willing to postpone profitability to grow revenue faster, but in that case one does expect good top-line growth.
Over half a decade AJ Lucas Group reduced its trailing twelve month revenue by 10% for each year. That puts it in an unattractive cohort, to put it mildly. So it's not that strange that the share price dropped 39% per year in that period. We don't think this is a particularly promising picture. Ironically, that behavior could create an opportunity for the contrarian investor - but only if there are good reasons to predict a brighter future.
The image below shows how earnings and revenue have tracked over time (if you click on the image you can see greater detail).
Take a more thorough look at AJ Lucas Group's financial health with this free report on its balance sheet.
What about the Total Shareholder Return (TSR)?
We've already covered AJ Lucas Group's share price action, but we should also mention its total shareholder return (TSR). The TSR attempts to capture the value of dividends (as if they were reinvested) as well as any spin-offs or discounted capital raisings offered to shareholders. Its history of dividend payouts mean that AJ Lucas Group's TSR, which was a 90% drop over the last 5 years, was not as bad as the share price return.
A Different Perspective
While the broader market gained around 23% in the last year, AJ Lucas Group shareholders lost 76%. However, keep in mind that even the best stocks will sometimes underperform the market over a twelve month period. Unfortunately, last year's performance may indicate unresolved challenges, given that it was worse than the annualised loss of 37% over the last half decade. We realise that Buffett has said investors should 'buy when there is blood on the streets', but we caution that investors should first be sure they are buying a high quality businesses. You might want to assess this data-rich visualization of its earnings, revenue and cash flow.
We will like AJ Lucas Group better if we see some big insider buys. While we wait, check out this free list of growing companies with considerable, recent, insider buying.
Please note, the market returns quoted in this article reflect the market weighted average returns of stocks that currently trade on AU exchanges.
If you spot an error that warrants correction, please contact the editor at editorial-team@simplywallst.com. This article by Simply Wall St is general in nature. It does not constitute a recommendation to buy or sell any stock, and does not take account of your objectives, or your financial situation. Simply Wall St has no position in the stocks mentioned.
We aim to bring you long-term focused research analysis driven by fundamental data. Note that our analysis may not factor in the latest price-sensitive company announcements or qualitative material. Thank you for reading.
