
 Yahoo Finance
 Did Cambridge Bancorp (NASDAQ:CATC) Create Value For Shareholders?

This analysis is intended to introduce important early concepts to people who are starting to invest and want to begin learning the link between Cambridge Bancorp (NASDAQ:CATC)’s return fundamentals and stock market performance.
Cambridge Bancorp (NASDAQ:CATC) delivered an ROE of 10.80% over the past 12 months, which is an impressive feat relative to its industry average of 8.45% during the same period. On the surface, this looks fantastic since we know that CATC has made large profits from little equity capital; however, ROE doesn’t tell us if management have borrowed heavily to make this happen. In this article, we’ll closely examine some factors like financial leverage to evaluate the sustainability of CATC’s ROE. See our latest analysis for Cambridge Bancorp
Breaking down Return on Equity
Return on Equity (ROE) weighs Cambridge Bancorp’s profit against the level of its shareholders’ equity. For example, if the company invests $1 in the form of equity, it will generate $0.11 in earnings from this. While a higher ROE is preferred in most cases, there are several other factors we should consider before drawing any conclusions.
Return on Equity = Net Profit ÷ Shareholders Equity
ROE is assessed against cost of equity, which is measured using the Capital Asset Pricing Model (CAPM) – but let’s not dive into the details of that today. For now, let’s just look at the cost of equity number for Cambridge Bancorp, which is 9.97%. Given a positive discrepancy of 0.83% between return and cost, this indicates that Cambridge Bancorp pays less for its capital than what it generates in return, which is a sign of capital efficiency. ROE can be broken down into three different ratios: net profit margin, asset turnover, and financial leverage. This is called the Dupont Formula:
Dupont Formula
ROE = profit margin × asset turnover × financial leverage
ROE = (annual net profit ÷ sales) × (sales ÷ assets) × (assets ÷ shareholders’ equity)
ROE = annual net profit ÷ shareholders’ equity

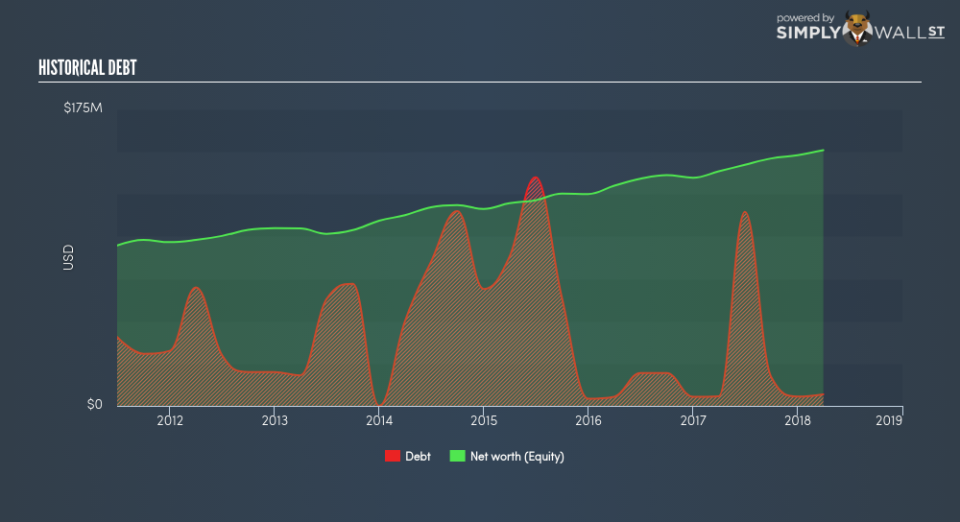
The first component is profit margin, which measures how much of sales is retained after the company pays for all its expenses. Asset turnover reveals how much revenue can be generated from Cambridge Bancorp’s asset base. And finally, financial leverage is simply how much of assets are funded by equity, which exhibits how sustainable the company’s capital structure is. Since ROE can be inflated by excessive debt, we need to examine Cambridge Bancorp’s debt-to-equity level. At 4.54%, Cambridge Bancorp’s debt-to-equity ratio appears low and indicates the above-average ROE is generated from its capacity to increase profit without a large debt burden.
Next Steps:
While ROE is a relatively simple calculation, it can be broken down into different ratios, each telling a different story about the strengths and weaknesses of a company. Cambridge Bancorp exhibits a strong ROE against its peers, as well as sufficient returns to cover its cost of equity. Its high ROE is not likely to be driven by high debt. Therefore, investors may have more confidence in the sustainability of this level of returns going forward. Although ROE can be a useful metric, it is only a small part of diligent research.
For Cambridge Bancorp, there are three essential aspects you should look at:
Financial Health: Does it have a healthy balance sheet? Take a look at our free balance sheet analysis with six simple checks on key factors like leverage and risk.
Future Earnings: How does Cambridge Bancorp’s growth rate compare to its peers and the wider market? Dig deeper into the analyst consensus number for the upcoming years by interacting with our free analyst growth expectation chart.
Other High-Growth Alternatives : Are there other high-growth stocks you could be holding instead of Cambridge Bancorp? Explore our interactive list of stocks with large growth potential to get an idea of what else is out there you may be missing!
To help readers see pass the short term volatility of the financial market, we aim to bring you a long-term focused research analysis purely driven by fundamental data. Note that our analysis does not factor in the latest price sensitive company announcements.
The author is an independent contributor and at the time of publication had no position in the stocks mentioned.
