
 Yahoo Finance
 How Did Abacus Property Group’s (ASX:ABP) 13% ROE Fare Against The Industry?

Many investors are still learning about the various metrics that can be useful when analysing a stock. This article is for those who would like to learn about Return On Equity (ROE). To keep the lesson grounded in practicality, we’ll use ROE to better understand Abacus Property Group (ASX:ABP).
Over the last twelve months Abacus Property Group has recorded a ROE of 13%. That means that for every A$1 worth of shareholders’ equity, it generated A$0.13 in profit.
See our latest analysis for Abacus Property Group
How Do I Calculate Return On Equity?
The formula for return on equity is:
Return on Equity = Net Profit ÷ Shareholders’ Equity
Or for Abacus Property Group:
13% = 243.709 ÷ AU$1.9b (Based on the trailing twelve months to June 2018.)
Most readers would understand what net profit is, but it’s worth explaining the concept of shareholders’ equity. It is all earnings retained by the company, plus any capital paid in by shareholders. The easiest way to calculate shareholders’ equity is to subtract the company’s total liabilities from the total assets.
What Does Return On Equity Signify?
ROE looks at the amount a company earns relative to the money it has kept within the business. The ‘return’ is the yearly profit. The higher the ROE, the more profit the company is making. So, as a general rule, a high ROE is a good thing. That means it can be interesting to compare the ROE of different companies.
Does Abacus Property Group Have A Good Return On Equity?
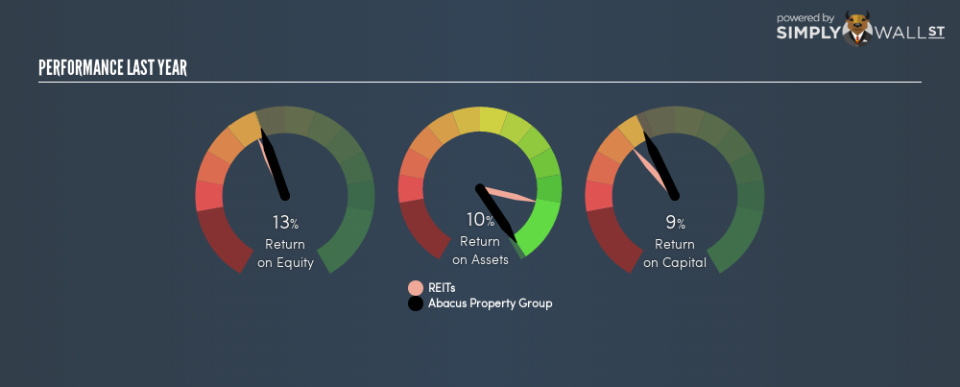
Arguably the easiest way to assess company’s ROE is to compare it with the average in its industry. Importantly, this is far from a perfect measure, because companies differ significantly within the same industry classification. If you look at the image below, you can see Abacus Property Group has a similar ROE to the average in the reits industry classification (12%).
That’s not overly surprising. Of course, this year’s ROE might be a product of last year’s decisions. So I like to check the tenure of the board and CEO, before reaching any conclusions.
How Does Debt Impact Return On Equity?
Most companies need money — from somewhere — to grow their profits. That cash can come from retained earnings, issuing new shares (equity), or debt. In the first two cases, the ROE will capture this use of capital to grow. In the latter case, the debt used for growth will improve returns, but won’t affect the total equity. In this manner the use of debt will boost ROE, even though the core economics of the business stay the same.
Combining Abacus Property Group’s Debt And Its 13% Return On Equity
Abacus Property Group has a debt to equity ratio of 0.38, which is far from excessive. Its very respectable ROE, combined with only modest debt, suggests the business is in good shape. Careful use of debt to boost returns is often very good for shareholders. However, it could reduce the company’s ability to take advantage of future opportunities.
But It’s Just One Metric
Return on equity is useful for comparing the quality of different businesses. A company that can achieve a high return on equity without debt could be considered a high quality business. If two companies have around the same level of debt to equity, and one has a higher ROE, I’d generally prefer the one with higher ROE.
But ROE is just one piece of a bigger puzzle, since high quality businesses often trade on high multiples of earnings. Profit growth rates, versus the expectations reflected in the price of the stock, are a particularly important to consider. So you might want to check this FREE visualization of analyst forecasts for the company.
If you would prefer check out another company — one with potentially superior financials — then do not miss this free list of interesting companies, that have HIGH return on equity and low debt.
To help readers see past the short term volatility of the financial market, we aim to bring you a long-term focused research analysis purely driven by fundamental data. Note that our analysis does not factor in the latest price-sensitive company announcements.
The author is an independent contributor and at the time of publication had no position in the stocks mentioned. For errors that warrant correction please contact the editor at editorial-team@simplywallst.com.
