
 Yahoo Finance
 DHT Holdings (NYSE:DHT) Has Gifted Shareholders With A Fantastic 112% Total Return On Their Investment
By buying an index fund, investors can approximate the average market return. But if you choose individual stocks with prowess, you can make superior returns. For example, DHT Holdings, Inc. (NYSE:DHT) shareholders have seen the share price rise 59% over three years, well in excess of the market return (39%, not including dividends). However, more recent returns haven't been as impressive as that, with the stock returning just 33% in the last year , including dividends .
See our latest analysis for DHT Holdings
There is no denying that markets are sometimes efficient, but prices do not always reflect underlying business performance. One flawed but reasonable way to assess how sentiment around a company has changed is to compare the earnings per share (EPS) with the share price.
DHT Holdings was able to grow its EPS at 218% per year over three years, sending the share price higher. This EPS growth is higher than the 17% average annual increase in the share price. Therefore, it seems the market has moderated its expectations for growth, somewhat. We'd venture the lowish P/E ratio of 3.34 also reflects the negative sentiment around the stock.
The company's earnings per share (over time) is depicted in the image below (click to see the exact numbers).
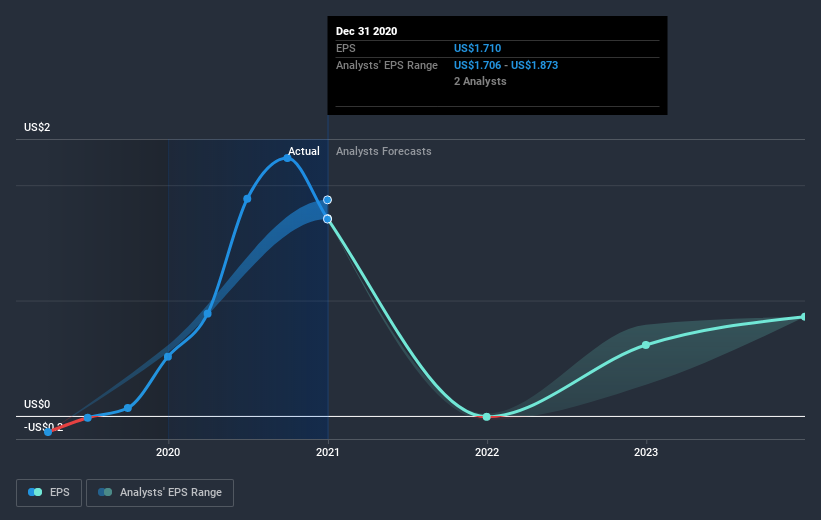
We know that DHT Holdings has improved its bottom line over the last three years, but what does the future have in store? Take a more thorough look at DHT Holdings' financial health with this free report on its balance sheet.
What About Dividends?
It is important to consider the total shareholder return, as well as the share price return, for any given stock. The TSR incorporates the value of any spin-offs or discounted capital raisings, along with any dividends, based on the assumption that the dividends are reinvested. It's fair to say that the TSR gives a more complete picture for stocks that pay a dividend. In the case of DHT Holdings, it has a TSR of 112% for the last 3 years. That exceeds its share price return that we previously mentioned. And there's no prize for guessing that the dividend payments largely explain the divergence!
A Different Perspective
DHT Holdings provided a TSR of 33% over the last twelve months. But that return falls short of the market. On the bright side, that's still a gain, and it's actually better than the average return of 6% over half a decade It is possible that returns will improve along with the business fundamentals. It's always interesting to track share price performance over the longer term. But to understand DHT Holdings better, we need to consider many other factors. For example, we've discovered 4 warning signs for DHT Holdings (1 shouldn't be ignored!) that you should be aware of before investing here.
We will like DHT Holdings better if we see some big insider buys. While we wait, check out this free list of growing companies with considerable, recent, insider buying.
Please note, the market returns quoted in this article reflect the market weighted average returns of stocks that currently trade on US exchanges.
This article by Simply Wall St is general in nature. It does not constitute a recommendation to buy or sell any stock, and does not take account of your objectives, or your financial situation. We aim to bring you long-term focused analysis driven by fundamental data. Note that our analysis may not factor in the latest price-sensitive company announcements or qualitative material. Simply Wall St has no position in any stocks mentioned.
Have feedback on this article? Concerned about the content? Get in touch with us directly. Alternatively, email editorial-team (at) simplywallst.com.
