
 Yahoo Finance
 Despite Its High P/E Ratio, Is Gentex Corporation (NASDAQ:GNTX) Still Undervalued?

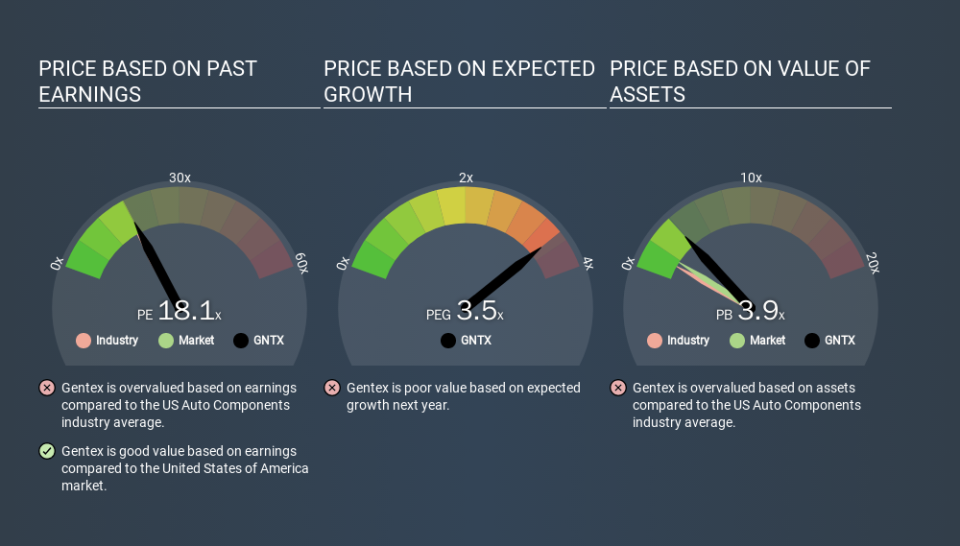
Today, we'll introduce the concept of the P/E ratio for those who are learning about investing. To keep it practical, we'll show how Gentex Corporation's (NASDAQ:GNTX) P/E ratio could help you assess the value on offer. Gentex has a price to earnings ratio of 18.13, based on the last twelve months. That corresponds to an earnings yield of approximately 5.5%.
See our latest analysis for Gentex
How Do I Calculate A Price To Earnings Ratio?
The formula for P/E is:
Price to Earnings Ratio = Share Price ÷ Earnings per Share (EPS)
Or for Gentex:
P/E of 18.13 = USD30.59 ÷ USD1.69 (Based on the trailing twelve months to December 2019.)
Is A High P/E Ratio Good?
The higher the P/E ratio, the higher the price tag of a business, relative to its trailing earnings. All else being equal, it's better to pay a low price -- but as Warren Buffett said, 'It's far better to buy a wonderful company at a fair price than a fair company at a wonderful price'.
How Does Gentex's P/E Ratio Compare To Its Peers?
We can get an indication of market expectations by looking at the P/E ratio. As you can see below Gentex has a P/E ratio that is fairly close for the average for the auto components industry, which is 17.3.
That indicates that the market expects Gentex will perform roughly in line with other companies in its industry. The company could surprise by performing better than average, in the future. Checking factors such as director buying and selling. could help you form your own view on if that will happen.
How Growth Rates Impact P/E Ratios
P/E ratios primarily reflect market expectations around earnings growth rates. That's because companies that grow earnings per share quickly will rapidly increase the 'E' in the equation. Therefore, even if you pay a high multiple of earnings now, that multiple will become lower in the future. And as that P/E ratio drops, the company will look cheap, unless its share price increases.
Gentex saw earnings per share improve by -3.2% last year. And its annual EPS growth rate over 5 years is 11%.
Remember: P/E Ratios Don't Consider The Balance Sheet
One drawback of using a P/E ratio is that it considers market capitalization, but not the balance sheet. In other words, it does not consider any debt or cash that the company may have on the balance sheet. Theoretically, a business can improve its earnings (and produce a lower P/E in the future) by investing in growth. That means taking on debt (or spending its cash).
Such spending might be good or bad, overall, but the key point here is that you need to look at debt to understand the P/E ratio in context.
Is Debt Impacting Gentex's P/E?
The extra options and safety that comes with Gentex's US$438m net cash position means that it deserves a higher P/E than it would if it had a lot of net debt.
The Verdict On Gentex's P/E Ratio
Gentex trades on a P/E ratio of 18.1, which is fairly close to the US market average of 18.2. EPS was up modestly better over the last twelve months. Also positive, the relatively strong balance sheet will allow for investment in growth. If this occurs the current P/E might prove to signify undervaluation.
Investors have an opportunity when market expectations about a stock are wrong. If the reality for a company is not as bad as the P/E ratio indicates, then the share price should increase as the market realizes this. So this free report on the analyst consensus forecasts could help you make a master move on this stock.
But note: Gentex may not be the best stock to buy. So take a peek at this free list of interesting companies with strong recent earnings growth (and a P/E ratio below 20).
If you spot an error that warrants correction, please contact the editor at editorial-team@simplywallst.com. This article by Simply Wall St is general in nature. It does not constitute a recommendation to buy or sell any stock, and does not take account of your objectives, or your financial situation. Simply Wall St has no position in the stocks mentioned.
We aim to bring you long-term focused research analysis driven by fundamental data. Note that our analysis may not factor in the latest price-sensitive company announcements or qualitative material. Thank you for reading.
