
 Yahoo Finance
 Despite Its High P/E Ratio, Is Gildan Activewear Inc. (TSE:GIL) Still Undervalued?

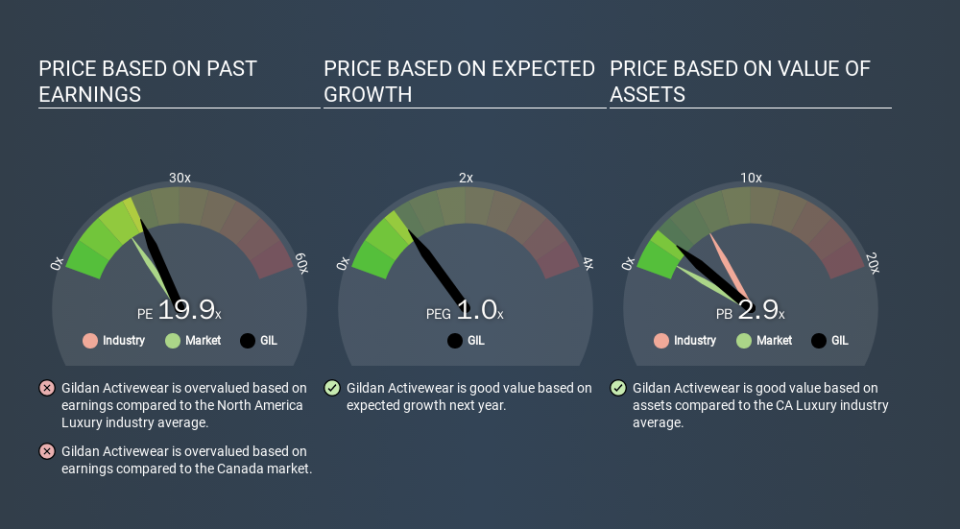
The goal of this article is to teach you how to use price to earnings ratios (P/E ratios). To keep it practical, we'll show how Gildan Activewear Inc.'s (TSE:GIL) P/E ratio could help you assess the value on offer. What is Gildan Activewear's P/E ratio? Well, based on the last twelve months it is 19.87. In other words, at today's prices, investors are paying CA$19.87 for every CA$1 in prior year profit.
See our latest analysis for Gildan Activewear
How Do I Calculate A Price To Earnings Ratio?
The formula for P/E is:
Price to Earnings Ratio = Price per Share (in the reporting currency) ÷ Earnings per Share (EPS)
Or for Gildan Activewear:
P/E of 19.87 = USD27.73 (Note: this is the share price in the reporting currency, namely, USD ) ÷ USD1.40 (Based on the year to September 2019.)
Is A High Price-to-Earnings Ratio Good?
A higher P/E ratio means that investors are paying a higher price for each USD1 of company earnings. That is not a good or a bad thing per se, but a high P/E does imply buyers are optimistic about the future.
How Does Gildan Activewear's P/E Ratio Compare To Its Peers?
One good way to get a quick read on what market participants expect of a company is to look at its P/E ratio. You can see in the image below that the average P/E (19.4) for companies in the luxury industry is roughly the same as Gildan Activewear's P/E.
That indicates that the market expects Gildan Activewear will perform roughly in line with other companies in its industry. If the company has better than average prospects, then the market might be underestimating it. Further research into factors such as insider buying and selling, could help you form your own view on whether that is likely.
How Growth Rates Impact P/E Ratios
Companies that shrink earnings per share quickly will rapidly decrease the 'E' in the equation. That means unless the share price falls, the P/E will increase in a few years. Then, a higher P/E might scare off shareholders, pushing the share price down.
Gildan Activewear's earnings per share fell by 13% in the last twelve months. And it has shrunk its earnings per share by 1.1% per year over the last five years. This could justify a pessimistic P/E.
Remember: P/E Ratios Don't Consider The Balance Sheet
It's important to note that the P/E ratio considers the market capitalization, not the enterprise value. Thus, the metric does not reflect cash or debt held by the company. The exact same company would hypothetically deserve a higher P/E ratio if it had a strong balance sheet, than if it had a weak one with lots of debt, because a cashed up company can spend on growth.
Spending on growth might be good or bad a few years later, but the point is that the P/E ratio does not account for the option (or lack thereof).
So What Does Gildan Activewear's Balance Sheet Tell Us?
Gildan Activewear's net debt is 16% of its market cap. That's enough debt to impact the P/E ratio a little; so keep it in mind if you're comparing it to companies without debt.
The Verdict On Gildan Activewear's P/E Ratio
Gildan Activewear trades on a P/E ratio of 19.9, which is above its market average of 15.4. With some debt but no EPS growth last year, the market has high expectations of future profits.
Investors have an opportunity when market expectations about a stock are wrong. People often underestimate remarkable growth -- so investors can make money when fast growth is not fully appreciated. So this free visual report on analyst forecasts could hold the key to an excellent investment decision.
Of course, you might find a fantastic investment by looking at a few good candidates. So take a peek at this free list of companies with modest (or no) debt, trading on a P/E below 20.
If you spot an error that warrants correction, please contact the editor at editorial-team@simplywallst.com. This article by Simply Wall St is general in nature. It does not constitute a recommendation to buy or sell any stock, and does not take account of your objectives, or your financial situation. Simply Wall St has no position in the stocks mentioned.
We aim to bring you long-term focused research analysis driven by fundamental data. Note that our analysis may not factor in the latest price-sensitive company announcements or qualitative material. Thank you for reading.
