
 Yahoo Finance
 Despite Its High P/E Ratio, Is Fairwood Holdings Limited (HKG:52) Still Undervalued?

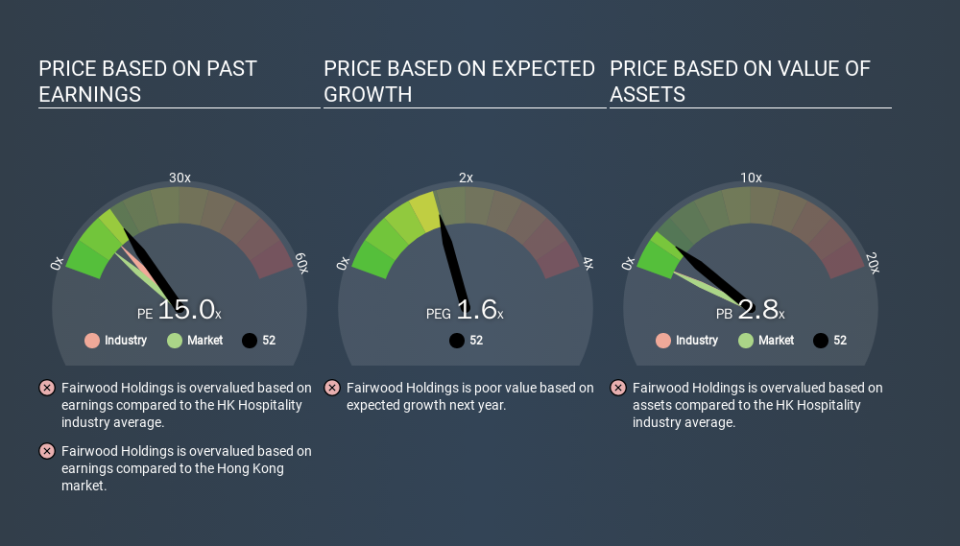
This article is for investors who would like to improve their understanding of price to earnings ratios (P/E ratios). We'll look at Fairwood Holdings Limited's (HKG:52) P/E ratio and reflect on what it tells us about the company's share price. Based on the last twelve months, Fairwood Holdings's P/E ratio is 15.02. That means that at current prices, buyers pay HK$15.02 for every HK$1 in trailing yearly profits.
Check out our latest analysis for Fairwood Holdings
How Do You Calculate A P/E Ratio?
The formula for P/E is:
Price to Earnings Ratio = Share Price ÷ Earnings per Share (EPS)
Or for Fairwood Holdings:
P/E of 15.02 = HK$15.900 ÷ HK$1.058 (Based on the trailing twelve months to September 2019.)
(Note: the above calculation results may not be precise due to rounding.)
Is A High Price-to-Earnings Ratio Good?
A higher P/E ratio means that buyers have to pay a higher price for each HK$1 the company has earned over the last year. All else being equal, it's better to pay a low price -- but as Warren Buffett said, 'It's far better to buy a wonderful company at a fair price than a fair company at a wonderful price'.
Does Fairwood Holdings Have A Relatively High Or Low P/E For Its Industry?
The P/E ratio indicates whether the market has higher or lower expectations of a company. As you can see below, Fairwood Holdings has a higher P/E than the average company (11.5) in the hospitality industry.
That means that the market expects Fairwood Holdings will outperform other companies in its industry. The market is optimistic about the future, but that doesn't guarantee future growth. So further research is always essential. I often monitor director buying and selling.
How Growth Rates Impact P/E Ratios
Companies that shrink earnings per share quickly will rapidly decrease the 'E' in the equation. That means even if the current P/E is low, it will increase over time if the share price stays flat. Then, a higher P/E might scare off shareholders, pushing the share price down.
Fairwood Holdings saw earnings per share decrease by 32% last year. But it has grown its earnings per share by 2.8% per year over the last five years. And EPS is down 13% a year, over the last 3 years. This might lead to low expectations.
Remember: P/E Ratios Don't Consider The Balance Sheet
One drawback of using a P/E ratio is that it considers market capitalization, but not the balance sheet. That means it doesn't take debt or cash into account. Hypothetically, a company could reduce its future P/E ratio by spending its cash (or taking on debt) to achieve higher earnings.
Spending on growth might be good or bad a few years later, but the point is that the P/E ratio does not account for the option (or lack thereof).
Fairwood Holdings's Balance Sheet
With net cash of HK$636m, Fairwood Holdings has a very strong balance sheet, which may be important for its business. Having said that, at 30% of its market capitalization the cash hoard would contribute towards a higher P/E ratio.
The Verdict On Fairwood Holdings's P/E Ratio
Fairwood Holdings trades on a P/E ratio of 15.0, which is above its market average of 8.8. The recent drop in earnings per share might keep value investors away, but the relatively strong balance sheet will allow the company time to invest in growth. Clearly, the high P/E indicates shareholders think it will!
Investors should be looking to buy stocks that the market is wrong about. If the reality for a company is better than it expects, you can make money by buying and holding for the long term. So this free visualization of the analyst consensus on future earnings could help you make the right decision about whether to buy, sell, or hold.
But note: Fairwood Holdings may not be the best stock to buy. So take a peek at this free list of interesting companies with strong recent earnings growth (and a P/E ratio below 20).
If you spot an error that warrants correction, please contact the editor at editorial-team@simplywallst.com. This article by Simply Wall St is general in nature. It does not constitute a recommendation to buy or sell any stock, and does not take account of your objectives, or your financial situation. Simply Wall St has no position in the stocks mentioned.
We aim to bring you long-term focused research analysis driven by fundamental data. Note that our analysis may not factor in the latest price-sensitive company announcements or qualitative material. Thank you for reading.
