
 Yahoo Finance
 Despite Its High P/E Ratio, Is Beacon Lighting Group Limited (ASX:BLX) Still Undervalued?

Want to participate in a short research study? Help shape the future of investing tools and you could win a $250 gift card!
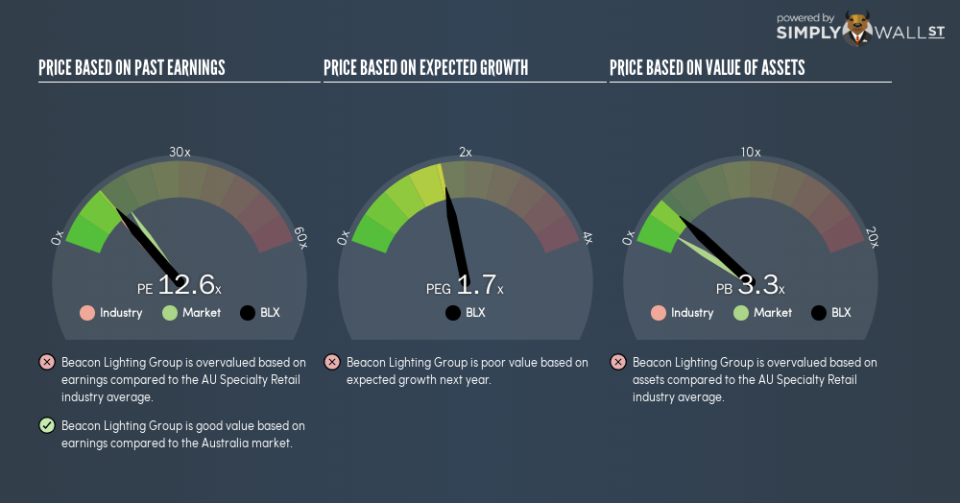
This article is written for those who want to get better at using price to earnings ratios (P/E ratios). We’ll show how you can use Beacon Lighting Group Limited’s (ASX:BLX) P/E ratio to inform your assessment of the investment opportunity. Beacon Lighting Group has a P/E ratio of 12.59, based on the last twelve months. That is equivalent to an earnings yield of about 7.9%.
View our latest analysis for Beacon Lighting Group
How Do I Calculate A Price To Earnings Ratio?
The formula for P/E is:
Price to Earnings Ratio = Price per Share ÷ Earnings per Share (EPS)
Or for Beacon Lighting Group:
P/E of 12.59 = A$1.15 ÷ A$0.091 (Based on the trailing twelve months to June 2018.)
Is A High Price-to-Earnings Ratio Good?
A higher P/E ratio means that investors are paying a higher price for each A$1 of company earnings. All else being equal, it’s better to pay a low price — but as Warren Buffett said, ‘It’s far better to buy a wonderful company at a fair price than a fair company at a wonderful price.’
How Growth Rates Impact P/E Ratios
Probably the most important factor in determining what P/E a company trades on is the earnings growth. When earnings grow, the ‘E’ increases, over time. That means even if the current P/E is high, it will reduce over time if the share price stays flat. A lower P/E should indicate the stock is cheap relative to others — and that may attract buyers.
Beacon Lighting Group increased earnings per share by an impressive 18% over the last twelve months. And earnings per share have improved by 14% annually, over the last five years. With that performance, you might expect an above average P/E ratio.
How Does Beacon Lighting Group’s P/E Ratio Compare To Its Peers?
We can get an indication of market expectations by looking at the P/E ratio. As you can see below, Beacon Lighting Group has a higher P/E than the average company (11.6) in the specialty retail industry.
Its relatively high P/E ratio indicates that Beacon Lighting Group shareholders think it will perform better than other companies in its industry classification. The market is optimistic about the future, but that doesn’t guarantee future growth. So investors should always consider the P/E ratio alongside other factors, such as whether company directors have been buying shares.
Remember: P/E Ratios Don’t Consider The Balance Sheet
Don’t forget that the P/E ratio considers market capitalization. Thus, the metric does not reflect cash or debt held by the company. Theoretically, a business can improve its earnings (and produce a lower P/E in the future), by taking on debt (or spending its remaining cash).
Such expenditure might be good or bad, in the long term, but the point here is that the balance sheet is not reflected by this ratio.
Beacon Lighting Group’s Balance Sheet
Net debt totals just 6.2% of Beacon Lighting Group’s market cap. The market might award it a higher P/E ratio if it had net cash, but its unlikely this low level of net borrowing is having a big impact on the P/E multiple.
The Bottom Line On Beacon Lighting Group’s P/E Ratio
Beacon Lighting Group has a P/E of 12.6. That’s below the average in the AU market, which is 15.3. The EPS growth last year was strong, and debt levels are quite reasonable. The low P/E ratio suggests current market expectations are muted, implying these levels of growth will not continue.
Investors have an opportunity when market expectations about a stock are wrong. If the reality for a company is not as bad as the P/E ratio indicates, then the share price should increase as the market realizes this. So this free report on the analyst consensus forecasts could help you make a master move on this stock.
Of course you might be able to find a better stock than Beacon Lighting Group. So you may wish to see this free collection of other companies that have grown earnings strongly.
To help readers see past the short term volatility of the financial market, we aim to bring you a long-term focused research analysis purely driven by fundamental data. Note that our analysis does not factor in the latest price-sensitive company announcements.
The author is an independent contributor and at the time of publication had no position in the stocks mentioned. For errors that warrant correction please contact the editor at editorial-team@simplywallst.com.
