
 Yahoo Finance
 Despite the downward trend in earnings at Sandfire Resources (ASX:SFR) the stock advances 7.9%, bringing five-year gains to 3.2%
It is doubtless a positive to see that the Sandfire Resources Limited (ASX:SFR) share price has gained some 59% in the last three months. But if you look at the last five years the returns have not been good. In fact, the share price is down 20%, which falls well short of the return you could get by buying an index fund.
The recent uptick of 7.9% could be a positive sign of things to come, so let's take a look at historical fundamentals.
See our latest analysis for Sandfire Resources
While the efficient markets hypothesis continues to be taught by some, it has been proven that markets are over-reactive dynamic systems, and investors are not always rational. One way to examine how market sentiment has changed over time is to look at the interaction between a company's share price and its earnings per share (EPS).
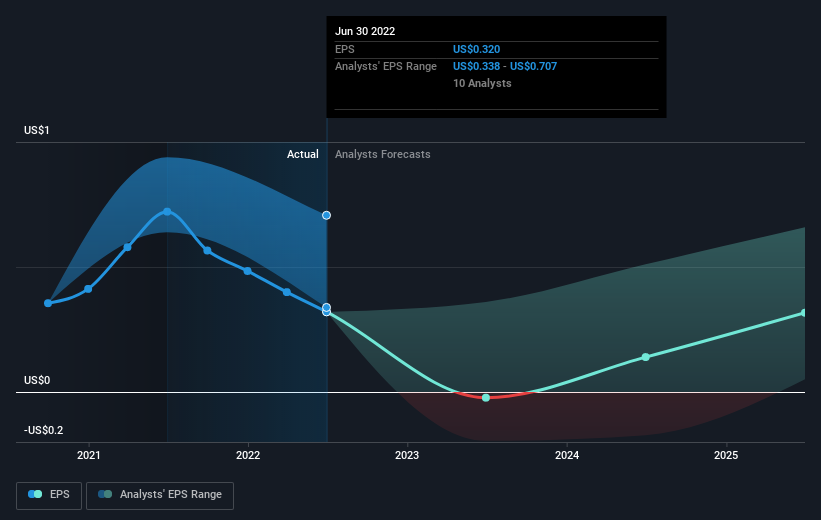
Looking back five years, both Sandfire Resources' share price and EPS declined; the latter at a rate of 7.9% per year. This fall in the EPS is worse than the 4% compound annual share price fall. The relatively muted share price reaction might be because the market expects the business to turn around.
You can see below how EPS has changed over time (discover the exact values by clicking on the image).
We like that insiders have been buying shares in the last twelve months. Having said that, most people consider earnings and revenue growth trends to be a more meaningful guide to the business. Dive deeper into the earnings by checking this interactive graph of Sandfire Resources' earnings, revenue and cash flow.
What About The Total Shareholder Return (TSR)?
We'd be remiss not to mention the difference between Sandfire Resources' total shareholder return (TSR) and its share price return. Arguably the TSR is a more complete return calculation because it accounts for the value of dividends (as if they were reinvested), along with the hypothetical value of any discounted capital that have been offered to shareholders. Sandfire Resources' TSR of 3.2% for the 5 years exceeded its share price return, because it has paid dividends.
A Different Perspective
While the broader market lost about 2.3% in the twelve months, Sandfire Resources shareholders did even worse, losing 15%. Having said that, it's inevitable that some stocks will be oversold in a falling market. The key is to keep your eyes on the fundamental developments. On the bright side, long term shareholders have made money, with a gain of 0.6% per year over half a decade. It could be that the recent sell-off is an opportunity, so it may be worth checking the fundamental data for signs of a long term growth trend. I find it very interesting to look at share price over the long term as a proxy for business performance. But to truly gain insight, we need to consider other information, too. Consider for instance, the ever-present spectre of investment risk. We've identified 2 warning signs with Sandfire Resources , and understanding them should be part of your investment process.
If you like to buy stocks alongside management, then you might just love this free list of companies. (Hint: insiders have been buying them).
Please note, the market returns quoted in this article reflect the market weighted average returns of stocks that currently trade on AU exchanges.
Have feedback on this article? Concerned about the content? Get in touch with us directly. Alternatively, email editorial-team (at) simplywallst.com.
This article by Simply Wall St is general in nature. We provide commentary based on historical data and analyst forecasts only using an unbiased methodology and our articles are not intended to be financial advice. It does not constitute a recommendation to buy or sell any stock, and does not take account of your objectives, or your financial situation. We aim to bring you long-term focused analysis driven by fundamental data. Note that our analysis may not factor in the latest price-sensitive company announcements or qualitative material. Simply Wall St has no position in any stocks mentioned.
Join A Paid User Research Session
You’ll receive a US$30 Amazon Gift card for 1 hour of your time while helping us build better investing tools for the individual investors like yourself. Sign up here
