
 Yahoo Finance
 Declining Stock and Solid Fundamentals: Is The Market Wrong About Solution Dynamics Limited (NZSE:SDL)?
With its stock down 25% over the past three months, it is easy to disregard Solution Dynamics (NZSE:SDL). However, stock prices are usually driven by a company’s financial performance over the long term, which in this case looks quite promising. Particularly, we will be paying attention to Solution Dynamics' ROE today.
ROE or return on equity is a useful tool to assess how effectively a company can generate returns on the investment it received from its shareholders. Simply put, it is used to assess the profitability of a company in relation to its equity capital.
See our latest analysis for Solution Dynamics
How Is ROE Calculated?
The formula for return on equity is:
Return on Equity = Net Profit (from continuing operations) ÷ Shareholders' Equity
So, based on the above formula, the ROE for Solution Dynamics is:
47% = NZ$3.4m ÷ NZ$7.4m (Based on the trailing twelve months to June 2023).
The 'return' is the profit over the last twelve months. Another way to think of that is that for every NZ$1 worth of equity, the company was able to earn NZ$0.47 in profit.
What Is The Relationship Between ROE And Earnings Growth?
So far, we've learned that ROE is a measure of a company's profitability. Depending on how much of these profits the company reinvests or "retains", and how effectively it does so, we are then able to assess a company’s earnings growth potential. Assuming all else is equal, companies that have both a higher return on equity and higher profit retention are usually the ones that have a higher growth rate when compared to companies that don't have the same features.
A Side By Side comparison of Solution Dynamics' Earnings Growth And 47% ROE
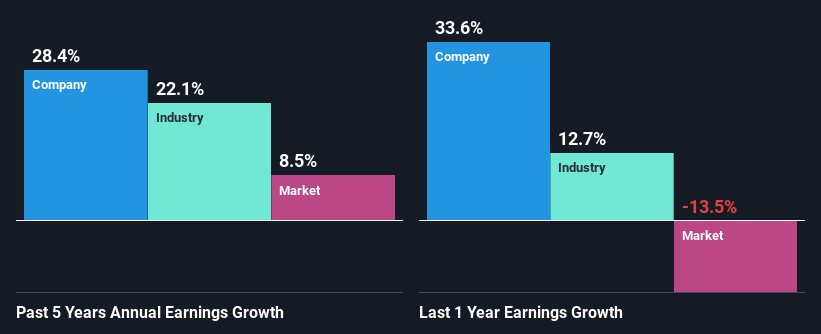
First thing first, we like that Solution Dynamics has an impressive ROE. Second, a comparison with the average ROE reported by the industry of 9.4% also doesn't go unnoticed by us. Under the circumstances, Solution Dynamics' considerable five year net income growth of 28% was to be expected.
Next, on comparing with the industry net income growth, we found that Solution Dynamics' growth is quite high when compared to the industry average growth of 22% in the same period, which is great to see.
The basis for attaching value to a company is, to a great extent, tied to its earnings growth. What investors need to determine next is if the expected earnings growth, or the lack of it, is already built into the share price. By doing so, they will have an idea if the stock is headed into clear blue waters or if swampy waters await. If you're wondering about Solution Dynamics''s valuation, check out this gauge of its price-to-earnings ratio, as compared to its industry.
Is Solution Dynamics Using Its Retained Earnings Effectively?
Solution Dynamics has a significant three-year median payout ratio of 71%, meaning the company only retains 29% of its income. This implies that the company has been able to achieve high earnings growth despite returning most of its profits to shareholders.
Moreover, Solution Dynamics is determined to keep sharing its profits with shareholders which we infer from its long history of eight years of paying a dividend.
Summary
On the whole, we feel that Solution Dynamics' performance has been quite good. We are particularly impressed by the considerable earnings growth posted by the company, which was likely backed by its high ROE. While the company is paying out most of its earnings as dividends, it has been able to grow its earnings in spite of it, so that's probably a good sign. Until now, we have only just grazed the surface of the company's past performance by looking at the company's fundamentals. To gain further insights into Solution Dynamics' past profit growth, check out this visualization of past earnings, revenue and cash flows.
Have feedback on this article? Concerned about the content? Get in touch with us directly. Alternatively, email editorial-team (at) simplywallst.com.
This article by Simply Wall St is general in nature. We provide commentary based on historical data and analyst forecasts only using an unbiased methodology and our articles are not intended to be financial advice. It does not constitute a recommendation to buy or sell any stock, and does not take account of your objectives, or your financial situation. We aim to bring you long-term focused analysis driven by fundamental data. Note that our analysis may not factor in the latest price-sensitive company announcements or qualitative material. Simply Wall St has no position in any stocks mentioned.
