
 Yahoo Finance
 Declining Stock and Solid Fundamentals: Is The Market Wrong About RBC Bearings Incorporated (NASDAQ:ROLL)?

RBC Bearings (NASDAQ:ROLL) has had a rough three months with its share price down 35%. However, a closer look at its sound financials might cause you to think again. Given that fundamentals usually drive long-term market outcomes, the company is worth looking at. Specifically, we decided to study RBC Bearings' ROE in this article.
Return on equity or ROE is a key measure used to assess how efficiently a company's management is utilizing the company's capital. Simply put, it is used to assess the profitability of a company in relation to its equity capital.
Check out our latest analysis for RBC Bearings
How To Calculate Return On Equity?
ROE can be calculated by using the formula:
Return on Equity = Net Profit (from continuing operations) ÷ Shareholders' Equity
So, based on the above formula, the ROE for RBC Bearings is:
11% = US$124m ÷ US$1.1b (Based on the trailing twelve months to December 2019).
The 'return' refers to a company's earnings over the last year. So, this means that for every $1 of its shareholder's investments, the company generates a profit of $0.11.
What Has ROE Got To Do With Earnings Growth?
So far, we've learnt that ROE is a measure of a company's profitability. Based on how much of its profits the company chooses to reinvest or "retain", we are then able to evaluate a company's future ability to generate profits. Assuming all else is equal, companies that have both a higher return on equity and higher profit retention are usually the ones that have a higher growth rate when compared to companies that don't have the same features.
RBC Bearings' Earnings Growth And 11% ROE
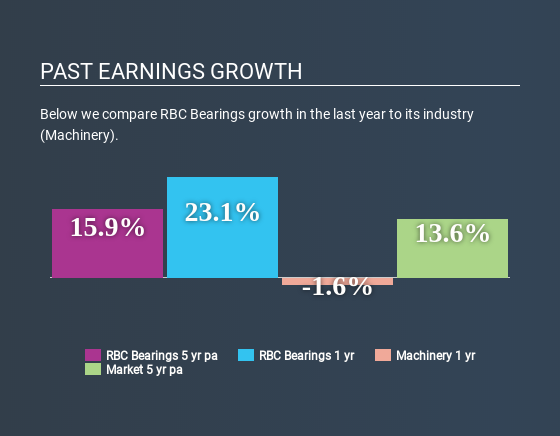
To begin with, RBC Bearings seems to have a respectable ROE. Even when compared to the industry average of 13% the company's ROE looks quite decent. Consequently, this likely laid the ground for the decent growth of 16% seen over the past five years by RBC Bearings.
Next, on comparing with the industry net income growth, we found that RBC Bearings' growth is quite high when compared to the industry average growth of 10% in the same period, which is great to see.
The basis for attaching value to a company is, to a great extent, tied to its earnings growth. It’s important for an investor to know whether the market has priced in the company's expected earnings growth (or decline). By doing so, they will have an idea if the stock is headed into clear blue waters or if swampy waters await. Is RBC Bearings fairly valued compared to other companies? These 3 valuation measures might help you decide.
Is RBC Bearings Efficiently Re-investing Its Profits?
RBC Bearings doesn't pay any dividend, meaning that all of its profits are being reinvested in the business, which explains the fair bit of earnings growth the company has seen.
Summary
Overall, we are quite pleased with RBC Bearings' performance. Specifically, we like that the company is reinvesting a huge chunk of its profits at a high rate of return. This of course has caused the company to see substantial growth in its earnings. With that said, on studying the latest analyst forecasts, we found that while the company has seen growth in its past earnings, analysts expect its future earnings to shrink. To know more about the latest analysts predictions for the company, check out this visualization of analyst forecasts for the company.
If you spot an error that warrants correction, please contact the editor at editorial-team@simplywallst.com. This article by Simply Wall St is general in nature. It does not constitute a recommendation to buy or sell any stock, and does not take account of your objectives, or your financial situation. Simply Wall St has no position in the stocks mentioned.
We aim to bring you long-term focused research analysis driven by fundamental data. Note that our analysis may not factor in the latest price-sensitive company announcements or qualitative material. Thank you for reading.
