
 Yahoo Finance
 Declining Stock and Solid Fundamentals: Is The Market Wrong About The Boston Beer Company, Inc. (NYSE:SAM)?
With its stock down 15% over the past month, it is easy to disregard Boston Beer Company (NYSE:SAM). However, stock prices are usually driven by a company’s financial performance over the long term, which in this case looks quite promising. Particularly, we will be paying attention to Boston Beer Company's ROE today.
Return on equity or ROE is an important factor to be considered by a shareholder because it tells them how effectively their capital is being reinvested. In simpler terms, it measures the profitability of a company in relation to shareholder's equity.
See our latest analysis for Boston Beer Company
How Do You Calculate Return On Equity?
Return on equity can be calculated by using the formula:
Return on Equity = Net Profit (from continuing operations) ÷ Shareholders' Equity
So, based on the above formula, the ROE for Boston Beer Company is:
19% = US$173m ÷ US$919m (Based on the trailing twelve months to September 2020).
The 'return' refers to a company's earnings over the last year. That means that for every $1 worth of shareholders' equity, the company generated $0.19 in profit.
What Has ROE Got To Do With Earnings Growth?
Thus far, we have learned that ROE measures how efficiently a company is generating its profits. Based on how much of its profits the company chooses to reinvest or "retain", we are then able to evaluate a company's future ability to generate profits. Assuming all else is equal, companies that have both a higher return on equity and higher profit retention are usually the ones that have a higher growth rate when compared to companies that don't have the same features.
Boston Beer Company's Earnings Growth And 19% ROE
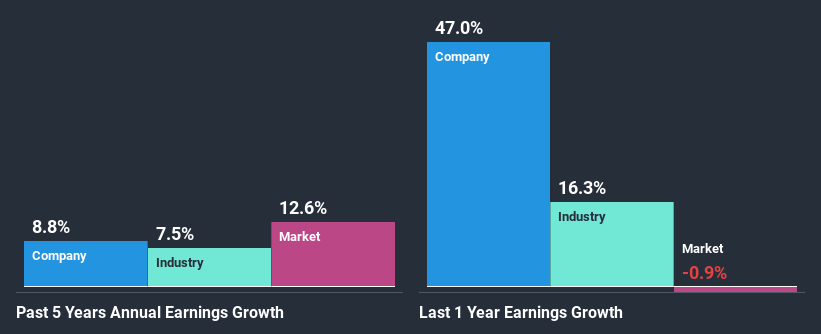
To begin with, Boston Beer Company seems to have a respectable ROE. Further, the company's ROE is similar to the industry average of 18%. Consequently, this likely laid the ground for the decent growth of 8.8% seen over the past five years by Boston Beer Company.
We then performed a comparison between Boston Beer Company's net income growth with the industry, which revealed that the company's growth is similar to the average industry growth of 7.5% in the same period.
Earnings growth is a huge factor in stock valuation. It’s important for an investor to know whether the market has priced in the company's expected earnings growth (or decline). Doing so will help them establish if the stock's future looks promising or ominous. Is Boston Beer Company fairly valued compared to other companies? These 3 valuation measures might help you decide.
Is Boston Beer Company Efficiently Re-investing Its Profits?
Conclusion
In total, we are pretty happy with Boston Beer Company's performance. Particularly, we like that the company is reinvesting heavily into its business, and at a high rate of return. Unsurprisingly, this has led to an impressive earnings growth. That being so, the latest analyst forecasts show that the company will continue to see an expansion in its earnings. Are these analysts expectations based on the broad expectations for the industry, or on the company's fundamentals? Click here to be taken to our analyst's forecasts page for the company.
This article by Simply Wall St is general in nature. It does not constitute a recommendation to buy or sell any stock, and does not take account of your objectives, or your financial situation. We aim to bring you long-term focused analysis driven by fundamental data. Note that our analysis may not factor in the latest price-sensitive company announcements or qualitative material. Simply Wall St has no position in any stocks mentioned.
Have feedback on this article? Concerned about the content? Get in touch with us directly. Alternatively, email editorial-team@simplywallst.com.
