
 Yahoo Finance
 Declining Stock and Decent Financials: Is The Market Wrong About XTEK Limited (ASX:XTE)?
It is hard to get excited after looking at XTEK's (ASX:XTE) recent performance, when its stock has declined 12% over the past three months. However, stock prices are usually driven by a company’s financials over the long term, which in this case look pretty respectable. Specifically, we decided to study XTEK's ROE in this article.
Return on Equity or ROE is a test of how effectively a company is growing its value and managing investors’ money. In short, ROE shows the profit each dollar generates with respect to its shareholder investments.
See our latest analysis for XTEK
How Do You Calculate Return On Equity?
The formula for ROE is:
Return on Equity = Net Profit (from continuing operations) ÷ Shareholders' Equity
So, based on the above formula, the ROE for XTEK is:
16% = AU$5.7m ÷ AU$35m (Based on the trailing twelve months to June 2022).
The 'return' is the profit over the last twelve months. So, this means that for every A$1 of its shareholder's investments, the company generates a profit of A$0.16.
What Has ROE Got To Do With Earnings Growth?
So far, we've learned that ROE is a measure of a company's profitability. Depending on how much of these profits the company reinvests or "retains", and how effectively it does so, we are then able to assess a company’s earnings growth potential. Assuming everything else remains unchanged, the higher the ROE and profit retention, the higher the growth rate of a company compared to companies that don't necessarily bear these characteristics.
XTEK's Earnings Growth And 16% ROE
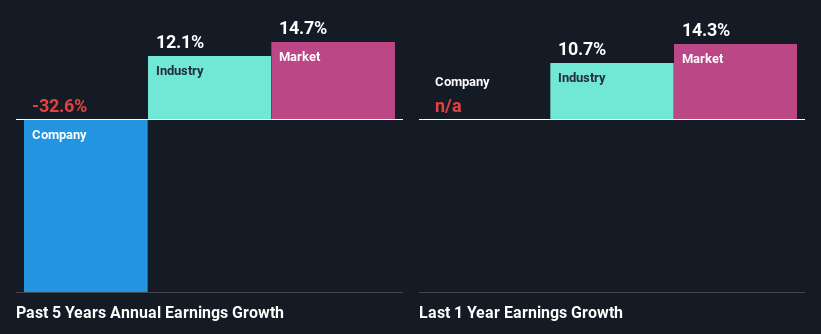
To start with, XTEK's ROE looks acceptable. Further, the company's ROE compares quite favorably to the industry average of 8.8%. As you might expect, the 33% net income decline reported by XTEK is a bit of a surprise. Therefore, there might be some other aspects that could explain this. Such as, the company pays out a huge portion of its earnings as dividends, or is faced with competitive pressures.
However, when we compared XTEK's growth with the industry we found that while the company's earnings have been shrinking, the industry has seen an earnings growth of 36% in the same period. This is quite worrisome.
The basis for attaching value to a company is, to a great extent, tied to its earnings growth. It’s important for an investor to know whether the market has priced in the company's expected earnings growth (or decline). Doing so will help them establish if the stock's future looks promising or ominous. Is XTEK fairly valued compared to other companies? These 3 valuation measures might help you decide.
Is XTEK Efficiently Re-investing Its Profits?
XTEK doesn't pay any dividend, meaning that potentially all of its profits are being reinvested in the business, which doesn't explain why the company's earnings have shrunk if it is retaining all of its profits. So there could be some other explanations in that regard. For instance, the company's business may be deteriorating.
Summary
Overall, we feel that XTEK certainly does have some positive factors to consider. However, given the high ROE and high profit retention, we would expect the company to be delivering strong earnings growth, but that isn't the case here. This suggests that there might be some external threat to the business, that's hampering its growth. While we won't completely dismiss the company, what we would do, is try to ascertain how risky the business is to make a more informed decision around the company. To know the 2 risks we have identified for XTEK visit our risks dashboard for free.
Have feedback on this article? Concerned about the content? Get in touch with us directly. Alternatively, email editorial-team (at) simplywallst.com.
This article by Simply Wall St is general in nature. We provide commentary based on historical data and analyst forecasts only using an unbiased methodology and our articles are not intended to be financial advice. It does not constitute a recommendation to buy or sell any stock, and does not take account of your objectives, or your financial situation. We aim to bring you long-term focused analysis driven by fundamental data. Note that our analysis may not factor in the latest price-sensitive company announcements or qualitative material. Simply Wall St has no position in any stocks mentioned.
Join A Paid User Research Session
You’ll receive a US$30 Amazon Gift card for 1 hour of your time while helping us build better investing tools for the individual investors like yourself. Sign up here
