
 Yahoo Finance
 Do You Like Data#3 Limited (ASX:DTL) At This P/E Ratio?

Want to participate in a research study? Help shape the future of investing tools and earn a $60 gift card!
This article is for investors who would like to improve their understanding of price to earnings ratios (P/E ratios). We'll show how you can use Data#3 Limited's (ASX:DTL) P/E ratio to inform your assessment of the investment opportunity. Data#3 has a P/E ratio of 15.78, based on the last twelve months. That is equivalent to an earnings yield of about 6.3%.
View our latest analysis for Data#3
How Do I Calculate A Price To Earnings Ratio?
The formula for P/E is:
Price to Earnings Ratio = Share Price ÷ Earnings per Share (EPS)
Or for Data#3:
P/E of 15.78 = A$1.8 ÷ A$0.11 (Based on the year to December 2018.)
Is A High Price-to-Earnings Ratio Good?
A higher P/E ratio means that investors are paying a higher price for each A$1 of company earnings. All else being equal, it's better to pay a low price -- but as Warren Buffett said, 'It's far better to buy a wonderful company at a fair price than a fair company at a wonderful price.'
How Growth Rates Impact P/E Ratios
Earnings growth rates have a big influence on P/E ratios. Earnings growth means that in the future the 'E' will be higher. Therefore, even if you pay a high multiple of earnings now, that multiple will become lower in the future. A lower P/E should indicate the stock is cheap relative to others -- and that may attract buyers.
It's nice to see that Data#3 grew EPS by a stonking 42% in the last year. And it has bolstered its earnings per share by 15% per year over the last five years. I'd therefore be a little surprised if its P/E ratio was not relatively high.
How Does Data#3's P/E Ratio Compare To Its Peers?
The P/E ratio essentially measures market expectations of a company. You can see in the image below that the average P/E (16.4) for companies in the it industry is roughly the same as Data#3's P/E.
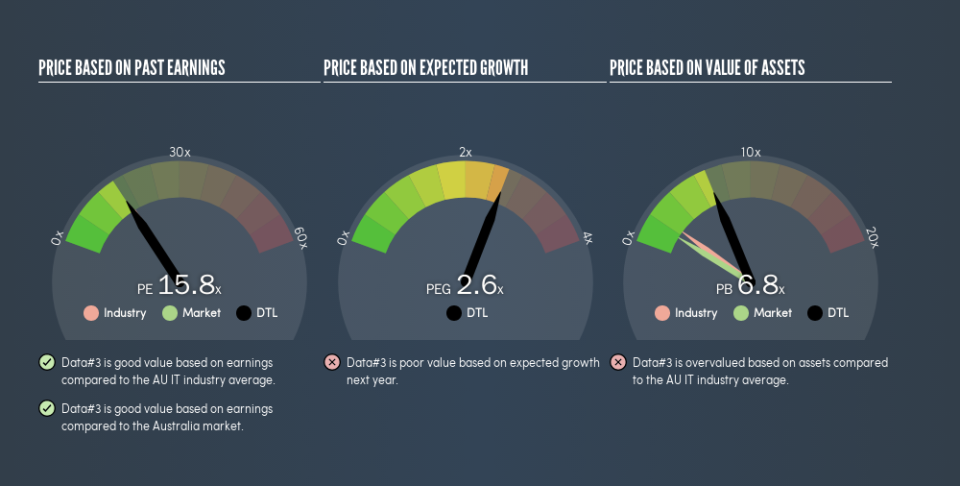
That indicates that the market expects Data#3 will perform roughly in line with other companies in its industry. The company could surprise by performing better than average, in the future. Further research into factors such asmanagement tenure, could help you form your own view on whether that is likely.
Don't Forget: The P/E Does Not Account For Debt or Bank Deposits
It's important to note that the P/E ratio considers the market capitalization, not the enterprise value. That means it doesn't take debt or cash into account. In theory, a company can lower its future P/E ratio by using cash or debt to invest in growth.
Spending on growth might be good or bad a few years later, but the point is that the P/E ratio does not account for the option (or lack thereof).
How Does Data#3's Debt Impact Its P/E Ratio?
Since Data#3 holds net cash of AU$7.2m, it can spend on growth, justifying a higher P/E ratio than otherwise.
The Verdict On Data#3's P/E Ratio
Data#3's P/E is 15.8 which is about average (16.2) in the AU market. The balance sheet is healthy, and recent EPS growth impressive, but the P/E implies some caution from the market.
Investors should be looking to buy stocks that the market is wrong about. If it is underestimating a company, investors can make money by buying and holding the shares until the market corrects itself. So this free visualization of the analyst consensus on future earnings could help you make the right decision about whether to buy, sell, or hold.
Of course, you might find a fantastic investment by looking at a few good candidates. So take a peek at this free list of companies with modest (or no) debt, trading on a P/E below 20.
We aim to bring you long-term focused research analysis driven by fundamental data. Note that our analysis may not factor in the latest price-sensitive company announcements or qualitative material.
If you spot an error that warrants correction, please contact the editor at editorial-team@simplywallst.com. This article by Simply Wall St is general in nature. It does not constitute a recommendation to buy or sell any stock, and does not take account of your objectives, or your financial situation. Simply Wall St has no position in the stocks mentioned. Thank you for reading.
