
 Yahoo Finance
 Darden Restaurants Inc's Dividend Analysis
Insightful Assessment of Darden Restaurants Inc's Upcoming Dividend
Darden Restaurants Inc (NYSE:DRI) recently announced a dividend of $1.31 per share, payable on 2024-05-01, with the ex-dividend date set for 2024-04-09. As investors look forward to this upcoming payment, the spotlight also shines on the company's dividend history, yield, and growth rates. Using the data from GuruFocus, let's look into Darden Restaurants Inc's dividend performance and assess its sustainability.
What Does Darden Restaurants Inc Do?
This Powerful Chart Made Peter Lynch 29% A Year For 13 Years
How to calculate the intrinsic value of a stock?
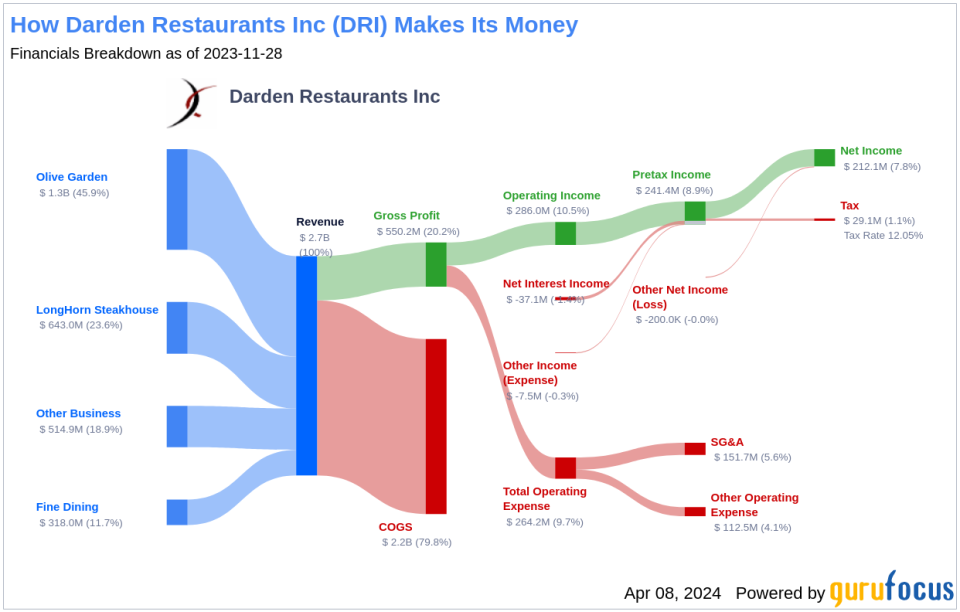
Darden Restaurants Inc (NYSE:DRI) is the largest restaurant operator in the U.S. full-service space, with consolidated revenue of $10.5 billion in fiscal 2023 resulting in 3%-4% full-service market share (per NRA data and our calculations). The company maintains a portfolio of 10 restaurant brands: Olive Garden, LongHorn Steakhouse, Cheddar's Scratch Kitchen, Ruth's Chris, Yard House, The Capital Grille, Seasons 52, Eddie V's, Bahama Breeze, and The Capital Burger. Darden Restaurants Inc generates revenue almost exclusively from company-owned restaurants, though a small network of franchised restaurants and consumer-packaged goods sales through the traditional grocery channel contribute modestly. As of the end of its fiscal 2023, the company operated 1,914 restaurants in the U.S.
A Glimpse at Darden Restaurants Inc's Dividend History
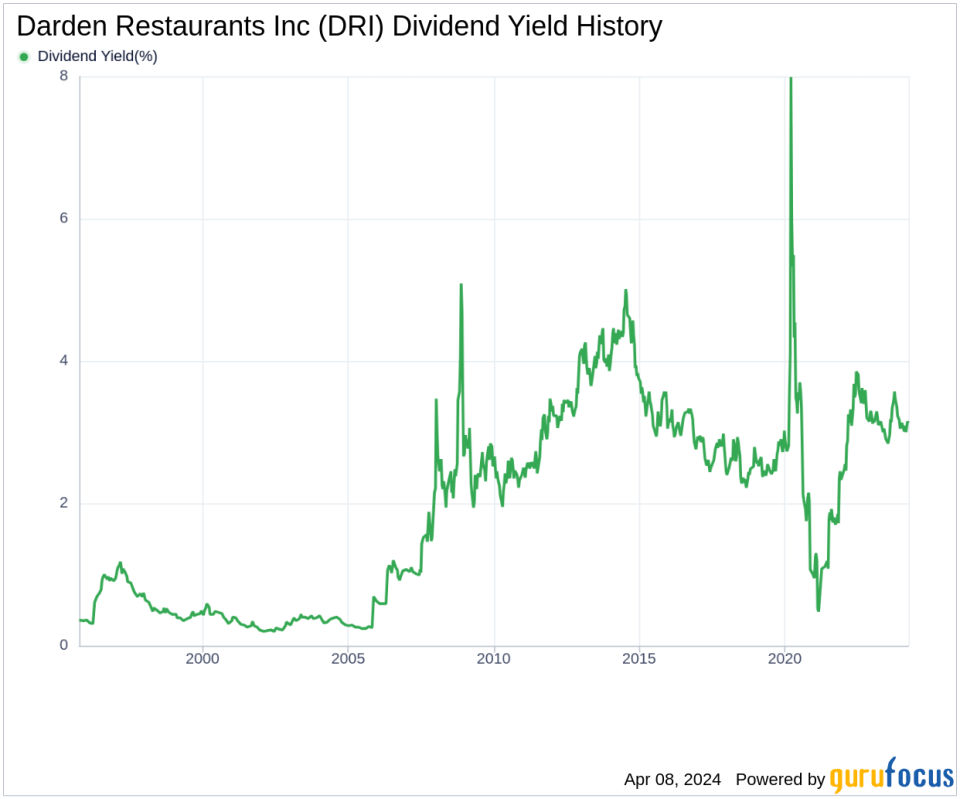
Darden Restaurants Inc has maintained a consistent dividend payment record since 1995. Dividends are currently distributed on a quarterly basis. Below is a chart showing annual Dividends Per Share for tracking historical trends.
Breaking Down Darden Restaurants Inc's Dividend Yield and Growth
As of today, Darden Restaurants Inc currently has a 12-month trailing dividend yield of 3.29% and a 12-month forward dividend yield of 3.35%. This suggests an expectation of increased dividend payments over the next 12 months.
Over the past three years, Darden Restaurants Inc's annual dividend growth rate was 22.40%. Extended to a five-year horizon, this rate decreased to 11.70% per year. And over the past decade, Darden Restaurants Inc's annual dividends per share growth rate stands at 6.50%.
Based on Darden Restaurants Inc's dividend yield and five-year growth rate, the 5-year yield on cost of Darden Restaurants Inc stock as of today is approximately 5.72%.
The Sustainability Question: Payout Ratio and Profitability
To assess the sustainability of the dividend, one needs to evaluate the company's payout ratio. The dividend payout ratio provides insights into the portion of earnings the company distributes as dividends. A lower ratio suggests that the company retains a significant part of its earnings, thereby ensuring the availability of funds for future growth and unexpected downturns. As of 2024-02-29, Darden Restaurants Inc's dividend payout ratio is 0.35.
Darden Restaurants Inc's profitability rank, offers an understanding of the company's earnings prowess relative to its peers. GuruFocus ranks Darden Restaurants Inc's profitability 8 out of 10 as of 2024-02-29, suggesting good profitability prospects. The company has reported net profit in 9 years out of the past 10 years.
Growth Metrics: The Future Outlook
To ensure the sustainability of dividends, a company must have robust growth metrics. Darden Restaurants Inc's growth rank of 8 out of 10 suggests that the company's growth trajectory is good relative to its competitors.
Revenue is the lifeblood of any company, and Darden Restaurants Inc's revenue per share, combined with the 3-year revenue growth rate, indicates a strong revenue model. Darden Restaurants Inc's revenue has increased by approximately 10.30% per year on average, a rate that outperforms approximately 67.37% of global competitors.
The company's 3-year EPS growth rate showcases its capability to grow its earnings, a critical component for sustaining dividends in the long run. During the past three years, Darden Restaurants Inc's earnings increased by approximately 60.40% per year on average, a rate that outperforms approximately 90.54% of global competitors.
Lastly, the company's 5-year EBITDA growth rate of 12.40%, which outperforms approximately 70.09% of global competitors.
Next Steps
In conclusion, Darden Restaurants Inc's upcoming dividend, alongside its historical dividend growth rate, indicates a commitment to rewarding shareholders. The company's prudent payout ratio and strong profitability suggest that these dividends are well-supported by earnings. Moreover, robust growth metrics provide confidence in the future outlook of Darden Restaurants Inc's dividend sustainability. Investors seeking to diversify their portfolio with a stock that combines steady income with growth potential may find Darden Restaurants Inc an attractive option. Will Darden Restaurants Inc continue to serve up dividends as appetizing as its culinary offerings? Only time will tell, but the current indicators are certainly promising.
GuruFocus Premium users can screen for high-dividend yield stocks using the High Dividend Yield Screener.
This article, generated by GuruFocus, is designed to provide general insights and is not tailored financial advice. Our commentary is rooted in historical data and analyst projections, utilizing an impartial methodology, and is not intended to serve as specific investment guidance. It does not formulate a recommendation to purchase or divest any stock and does not consider individual investment objectives or financial circumstances. Our objective is to deliver long-term, fundamental data-driven analysis. Be aware that our analysis might not incorporate the most recent, price-sensitive company announcements or qualitative information. GuruFocus holds no position in the stocks mentioned herein.
This article first appeared on GuruFocus.
