
 Yahoo Finance
 D.R. Horton's (NYSE:DHI) five-year total shareholder returns outpace the underlying earnings growth
When we invest, we're generally looking for stocks that outperform the market average. And in our experience, buying the right stocks can give your wealth a significant boost. For example, long term D.R. Horton, Inc. (NYSE:DHI) shareholders have enjoyed a 93% share price rise over the last half decade, well in excess of the market return of around 49% (not including dividends).
Since the long term performance has been good but there's been a recent pullback of 3.0%, let's check if the fundamentals match the share price.
See our latest analysis for D.R. Horton
There is no denying that markets are sometimes efficient, but prices do not always reflect underlying business performance. One imperfect but simple way to consider how the market perception of a company has shifted is to compare the change in the earnings per share (EPS) with the share price movement.
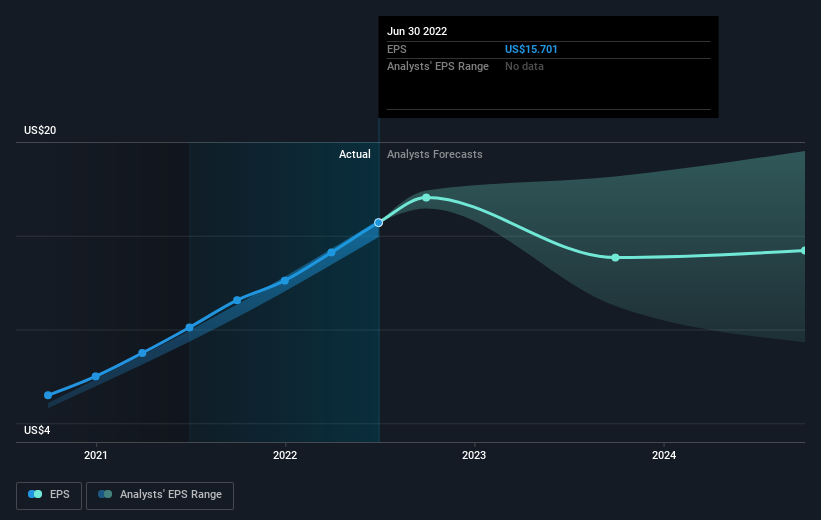
Over half a decade, D.R. Horton managed to grow its earnings per share at 43% a year. The EPS growth is more impressive than the yearly share price gain of 14% over the same period. Therefore, it seems the market has become relatively pessimistic about the company. This cautious sentiment is reflected in its (fairly low) P/E ratio of 4.44.
The image below shows how EPS has tracked over time (if you click on the image you can see greater detail).
We know that D.R. Horton has improved its bottom line over the last three years, but what does the future have in store? This free interactive report on D.R. Horton's balance sheet strength is a great place to start, if you want to investigate the stock further.
What About Dividends?
It is important to consider the total shareholder return, as well as the share price return, for any given stock. The TSR incorporates the value of any spin-offs or discounted capital raisings, along with any dividends, based on the assumption that the dividends are reinvested. Arguably, the TSR gives a more comprehensive picture of the return generated by a stock. As it happens, D.R. Horton's TSR for the last 5 years was 104%, which exceeds the share price return mentioned earlier. This is largely a result of its dividend payments!
A Different Perspective
We regret to report that D.R. Horton shareholders are down 21% for the year (even including dividends). Unfortunately, that's worse than the broader market decline of 17%. However, it could simply be that the share price has been impacted by broader market jitters. It might be worth keeping an eye on the fundamentals, in case there's a good opportunity. Longer term investors wouldn't be so upset, since they would have made 15%, each year, over five years. If the fundamental data continues to indicate long term sustainable growth, the current sell-off could be an opportunity worth considering. It's always interesting to track share price performance over the longer term. But to understand D.R. Horton better, we need to consider many other factors. To that end, you should learn about the 3 warning signs we've spotted with D.R. Horton (including 2 which make us uncomfortable) .
For those who like to find winning investments this free list of growing companies with recent insider purchasing, could be just the ticket.
Please note, the market returns quoted in this article reflect the market weighted average returns of stocks that currently trade on US exchanges.
Have feedback on this article? Concerned about the content? Get in touch with us directly. Alternatively, email editorial-team (at) simplywallst.com.
This article by Simply Wall St is general in nature. We provide commentary based on historical data and analyst forecasts only using an unbiased methodology and our articles are not intended to be financial advice. It does not constitute a recommendation to buy or sell any stock, and does not take account of your objectives, or your financial situation. We aim to bring you long-term focused analysis driven by fundamental data. Note that our analysis may not factor in the latest price-sensitive company announcements or qualitative material. Simply Wall St has no position in any stocks mentioned.
Join A Paid User Research Session
You’ll receive a US$30 Amazon Gift card for 1 hour of your time while helping us build better investing tools for the individual investors like yourself. Sign up here
