
 Yahoo Finance
 Crude Oil Threatens Chart Support, SPX 500 Drops to 2-Week Low
DailyFX.com -
Talking Points:
US Dollar Challenges Monthly Range Resistance Anew
S&P 500 Breaks Range Bottom, Drops to 2-Week Low
Gold Consolidating, Crude Oil Stalls at Chart Support
Can’t access the Dow Jones FXCM US Dollar Index? Try the USD basket on Mirror Trader. **
US DOLLAR TECHNICAL ANALYSIS – Prices have returned to test the top of a now-familiar range top capping gains since late January. Near-term resistance is in the 11854-76 area (14.6% Fibonacci expansion, March 2009 high), with a break above that on a daily closing basis exposing the 23.6% level at 11963. Alternatively, a below the 14.6% Fib retracementat 11740 opens the door for a challenge of the 23.6% threshold at 11653.
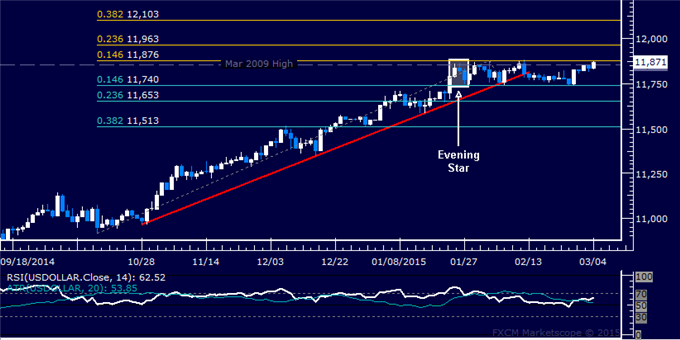
Daily Chart - Created Using FXCM Marketscope
** The Dow Jones FXCM US Dollar Index and the Mirror Trader USD basket are not the same product.
S&P 500 TECHNICAL ANALYSIS – Prices took out range support at 2101.40, with sellers now aiming to challenge the 23.6% Fibonacci retracement at 2086.40. A break below this barrier exposes the 38.2% level at 2066.00. Alternatively, a reversal back above 2101.40 aims for the February 25 high at 2119.40.

Daily Chart - Created Using FXCM Marketscope
GOLD TECHNICAL ANALYSIS – Prices continue to consolidate after descending to a two-month low below the $1200/oz figure. A break below the 23.6% Fibonacci expansion at 1194.94 exposes the 38.2% level at 1177.51. Alternatively, a rebound above the 1216.30-20.72 area marked by trend line support-turned-resistance and the 23.6% Fib retracement targets the 38.2% threshold at 1233.73.
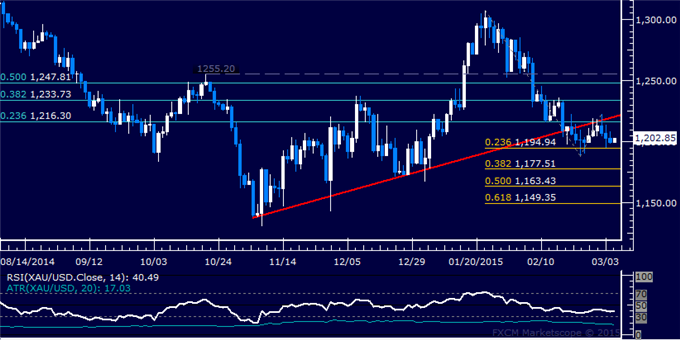
Daily Chart - Created Using FXCM Marketscope
CRUDE OIL TECHNICAL ANALYSIS – Prices launched a recovery as expected, with buyers now consolidating below February’s swing high. From here, a break below channel support at 60.52 exposes resistance-turned-support at 58.17. Alternatively, a close above the February 17 high at 62.98 exposes the 38.2% Fibonacci expansion at 66.69.

Daily Chart - Created Using FXCM Marketscope
--- Written by Ilya Spivak, Currency Strategist for DailyFX.com
To receive Ilya's analysis directly via email, please SIGN UP HERE
Contact and follow Ilya on Twitter: @IlyaSpivak
DailyFX provides forex news and technical analysis on the trends that influence the global currency markets.
Learn forex trading with a free practice account and trading charts from FXCM.
