
 Yahoo Finance
 Crude Oil Monthly High at 47.72 Intersects Trendline Soon
DailyFX.com -
Daily
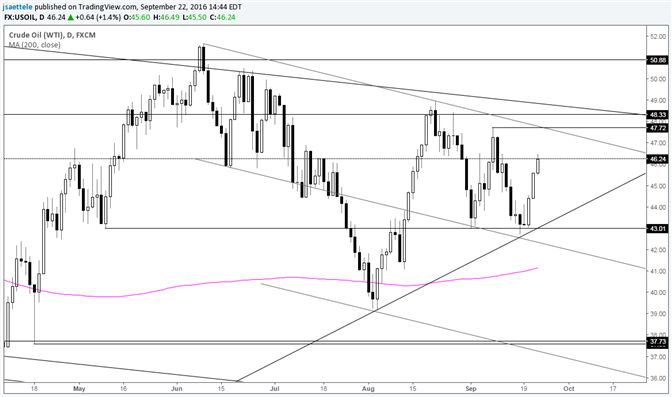
Chart Prepared by Jamie Saettele, CMT
DailyFX Trading Guides and Forecasts
-The possible yearlong head and shoulders pattern (lows in August 2015, February 2016 and August 2016) is intriguing but the right shoulder could form for quite some time before the next advance. 43 and mid-48.00s are well defined market levels (the former level has been support the last 3 days). A break of one of these levels is needed in order to set direction for the next move. For more on crude, check out this analog. Near term, watch for 47.72 resistance.
For more analysis and trade setups, visit SB Trade Desk
DailyFX provides forex news and technical analysis on the trends that influence the global currency markets.
Learn forex trading with a free practice account and trading charts from FXCM.
