
 Yahoo Finance
 Crown Castle International's (NYSE:CCI) earnings growth rate lags the 17% CAGR delivered to shareholders
Crown Castle International Corp. (NYSE:CCI) shareholders have seen the share price descend 11% over the month. While that's not great, the returns over five years have been decent. After all, the stock has performed better than the market (78%) in that time, and is up 83%.
Although Crown Castle International has shed US$2.4b from its market cap this week, let's take a look at its longer term fundamental trends and see if they've driven returns.
Check out our latest analysis for Crown Castle International
While markets are a powerful pricing mechanism, share prices reflect investor sentiment, not just underlying business performance. By comparing earnings per share (EPS) and share price changes over time, we can get a feel for how investor attitudes to a company have morphed over time.
During five years of share price growth, Crown Castle International achieved compound earnings per share (EPS) growth of 24% per year. The EPS growth is more impressive than the yearly share price gain of 13% over the same period. So it seems the market isn't so enthusiastic about the stock these days. Of course, with a P/E ratio of 52.09, the market remains optimistic.
The company's earnings per share (over time) is depicted in the image below (click to see the exact numbers).
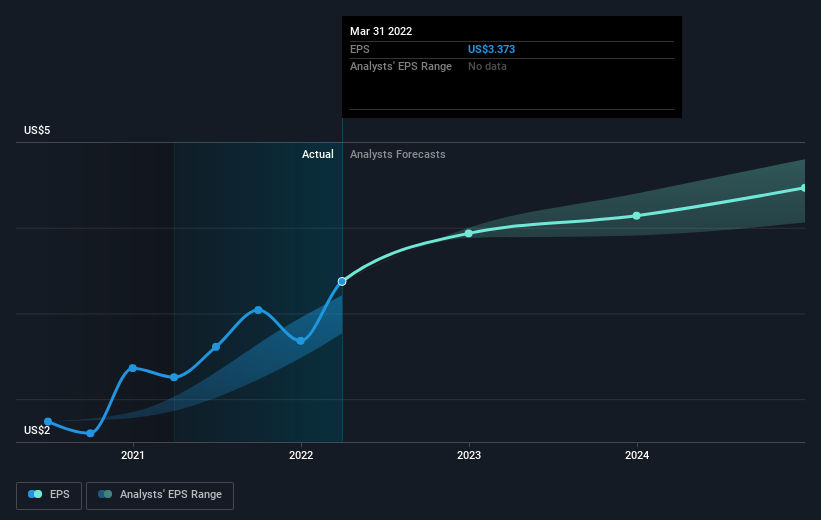
It's good to see that there was some significant insider buying in the last three months. That's a positive. On the other hand, we think the revenue and earnings trends are much more meaningful measures of the business. Before buying or selling a stock, we always recommend a close examination of historic growth trends, available here..
What About Dividends?
As well as measuring the share price return, investors should also consider the total shareholder return (TSR). The TSR is a return calculation that accounts for the value of cash dividends (assuming that any dividend received was reinvested) and the calculated value of any discounted capital raisings and spin-offs. Arguably, the TSR gives a more comprehensive picture of the return generated by a stock. We note that for Crown Castle International the TSR over the last 5 years was 117%, which is better than the share price return mentioned above. The dividends paid by the company have thusly boosted the total shareholder return.
A Different Perspective
While it's never nice to take a loss, Crown Castle International shareholders can take comfort that , including dividends,their trailing twelve month loss of 1.4% wasn't as bad as the market loss of around 10%. Longer term investors wouldn't be so upset, since they would have made 17%, each year, over five years. In the best case scenario the last year is just a temporary blip on the journey to a brighter future. While it is well worth considering the different impacts that market conditions can have on the share price, there are other factors that are even more important. Take risks, for example - Crown Castle International has 3 warning signs (and 1 which shouldn't be ignored) we think you should know about.
If you like to buy stocks alongside management, then you might just love this free list of companies. (Hint: insiders have been buying them).
Please note, the market returns quoted in this article reflect the market weighted average returns of stocks that currently trade on US exchanges.
Have feedback on this article? Concerned about the content? Get in touch with us directly. Alternatively, email editorial-team (at) simplywallst.com.
This article by Simply Wall St is general in nature. We provide commentary based on historical data and analyst forecasts only using an unbiased methodology and our articles are not intended to be financial advice. It does not constitute a recommendation to buy or sell any stock, and does not take account of your objectives, or your financial situation. We aim to bring you long-term focused analysis driven by fundamental data. Note that our analysis may not factor in the latest price-sensitive company announcements or qualitative material. Simply Wall St has no position in any stocks mentioned.