
 Yahoo Finance
 Is Crossland Strategic Metals (ASX:CUX) Using Too Much Debt?
Warren Buffett famously said, 'Volatility is far from synonymous with risk.' When we think about how risky a company is, we always like to look at its use of debt, since debt overload can lead to ruin. We can see that Crossland Strategic Metals Limited (ASX:CUX) does use debt in its business. But should shareholders be worried about its use of debt?
When Is Debt Dangerous?
Debt and other liabilities become risky for a business when it cannot easily fulfill those obligations, either with free cash flow or by raising capital at an attractive price. Part and parcel of capitalism is the process of 'creative destruction' where failed businesses are mercilessly liquidated by their bankers. While that is not too common, we often do see indebted companies permanently diluting shareholders because lenders force them to raise capital at a distressed price. By replacing dilution, though, debt can be an extremely good tool for businesses that need capital to invest in growth at high rates of return. The first thing to do when considering how much debt a business uses is to look at its cash and debt together.
See our latest analysis for Crossland Strategic Metals
What Is Crossland Strategic Metals's Net Debt?
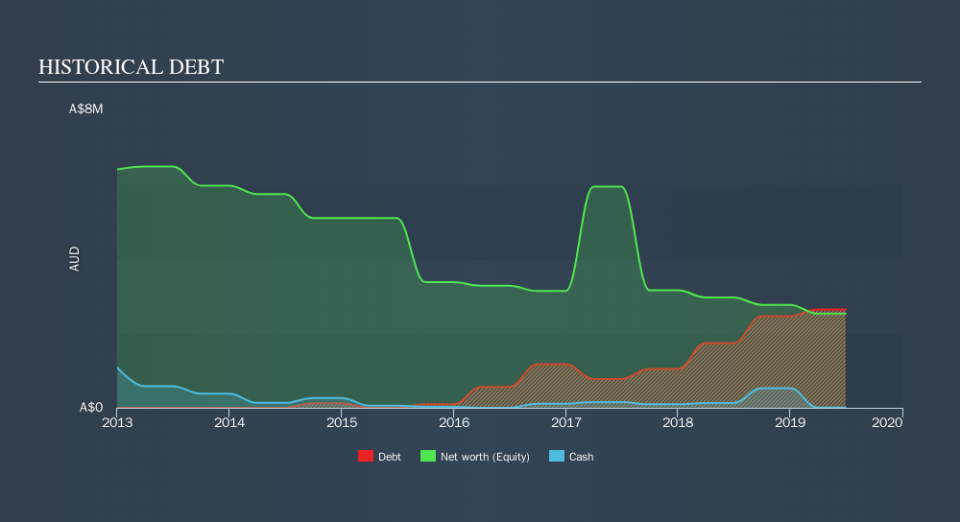
You can click the graphic below for the historical numbers, but it shows that as of June 2019 Crossland Strategic Metals had AU$2.64m of debt, an increase on AU$1.74m, over one year. Net debt is about the same, since the it doesn't have much cash.
How Strong Is Crossland Strategic Metals's Balance Sheet?
We can see from the most recent balance sheet that Crossland Strategic Metals had liabilities of AU$2.70m falling due within a year, and liabilities of AU$20.0k due beyond that. Offsetting this, it had AU$5.0k in cash and AU$37.0k in receivables that were due within 12 months. So its liabilities total AU$2.67m more than the combination of its cash and short-term receivables.
While this might seem like a lot, it is not so bad since Crossland Strategic Metals has a market capitalization of AU$7.08m, and so it could probably strengthen its balance sheet by raising capital if it needed to. However, it is still worthwhile taking a close look at its ability to pay off debt. The balance sheet is clearly the area to focus on when you are analysing debt. But you can't view debt in total isolation; since Crossland Strategic Metals will need earnings to service that debt. So if you're keen to discover more about its earnings, it might be worth checking out this graph of its long term earnings trend.
Since Crossland Strategic Metals has no significant operating revenue, shareholders probably hope it will develop a valuable new mine before too long.
Caveat Emptor
Over the last twelve months Crossland Strategic Metals produced an earnings before interest and tax (EBIT) loss. To be specific the EBIT loss came in at AU$296k. Considering that alongside the liabilities mentioned above does not give us much confidence that company should be using so much debt. So we think its balance sheet is a little strained, though not beyond repair. Another cause for caution is that is bled AU$838k in negative free cash flow over the last twelve months. So suffice it to say we consider the stock very risky. For riskier companies like Crossland Strategic Metals I always like to keep an eye on the long term profit and revenue trends. Fortunately, you can click to see our interactive graph of its profit, revenue, and operating cashflow.
At the end of the day, it's often better to focus on companies that are free from net debt. You can access our special list of such companies (all with a track record of profit growth). It's free.
We aim to bring you long-term focused research analysis driven by fundamental data. Note that our analysis may not factor in the latest price-sensitive company announcements or qualitative material.
If you spot an error that warrants correction, please contact the editor at editorial-team@simplywallst.com. This article by Simply Wall St is general in nature. It does not constitute a recommendation to buy or sell any stock, and does not take account of your objectives, or your financial situation. Simply Wall St has no position in the stocks mentioned. Thank you for reading.
