
 Yahoo Finance
 Cricut (NASDAQ:CRCT) Could Be Struggling To Allocate Capital
If you're looking for a multi-bagger, there's a few things to keep an eye out for. Firstly, we'd want to identify a growing return on capital employed (ROCE) and then alongside that, an ever-increasing base of capital employed. Ultimately, this demonstrates that it's a business that is reinvesting profits at increasing rates of return. However, after briefly looking over the numbers, we don't think Cricut (NASDAQ:CRCT) has the makings of a multi-bagger going forward, but let's have a look at why that may be.
What Is Return On Capital Employed (ROCE)?
For those who don't know, ROCE is a measure of a company's yearly pre-tax profit (its return), relative to the capital employed in the business. The formula for this calculation on Cricut is:
Return on Capital Employed = Earnings Before Interest and Tax (EBIT) ÷ (Total Assets - Current Liabilities)
0.15 = US$115m ÷ (US$947m - US$193m) (Based on the trailing twelve months to September 2022).
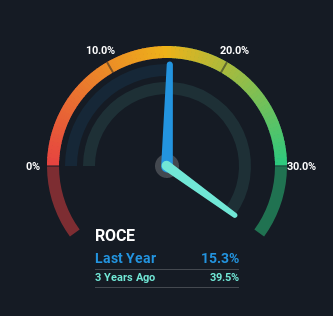
Therefore, Cricut has an ROCE of 15%. In absolute terms, that's a pretty normal return, and it's somewhat close to the Consumer Durables industry average of 17%.
See our latest analysis for Cricut
Above you can see how the current ROCE for Cricut compares to its prior returns on capital, but there's only so much you can tell from the past. If you'd like, you can check out the forecasts from the analysts covering Cricut here for free.
How Are Returns Trending?
On the surface, the trend of ROCE at Cricut doesn't inspire confidence. To be more specific, ROCE has fallen from 39% over the last three years. And considering revenue has dropped while employing more capital, we'd be cautious. This could mean that the business is losing its competitive advantage or market share, because while more money is being put into ventures, it's actually producing a lower return - "less bang for their buck" per se.
On a related note, Cricut has decreased its current liabilities to 20% of total assets. So we could link some of this to the decrease in ROCE. Effectively this means their suppliers or short-term creditors are funding less of the business, which reduces some elements of risk. Some would claim this reduces the business' efficiency at generating ROCE since it is now funding more of the operations with its own money.
The Bottom Line
We're a bit apprehensive about Cricut because despite more capital being deployed in the business, returns on that capital and sales have both fallen. Long term shareholders who've owned the stock over the last year have experienced a 67% depreciation in their investment, so it appears the market might not like these trends either. With underlying trends that aren't great in these areas, we'd consider looking elsewhere.
Cricut does have some risks though, and we've spotted 2 warning signs for Cricut that you might be interested in.
While Cricut may not currently earn the highest returns, we've compiled a list of companies that currently earn more than 25% return on equity. Check out this free list here.
Have feedback on this article? Concerned about the content? Get in touch with us directly. Alternatively, email editorial-team (at) simplywallst.com.
This article by Simply Wall St is general in nature. We provide commentary based on historical data and analyst forecasts only using an unbiased methodology and our articles are not intended to be financial advice. It does not constitute a recommendation to buy or sell any stock, and does not take account of your objectives, or your financial situation. We aim to bring you long-term focused analysis driven by fundamental data. Note that our analysis may not factor in the latest price-sensitive company announcements or qualitative material. Simply Wall St has no position in any stocks mentioned.
Join A Paid User Research Session
You’ll receive a US$30 Amazon Gift card for 1 hour of your time while helping us build better investing tools for the individual investors like yourself. Sign up here
