
 Yahoo Finance
 Crest Nicholson Holdings (LON:CRST) Will Be Hoping To Turn Its Returns On Capital Around
When we're researching a company, it's sometimes hard to find the warning signs, but there are some financial metrics that can help spot trouble early. When we see a declining return on capital employed (ROCE) in conjunction with a declining base of capital employed, that's often how a mature business shows signs of aging. Trends like this ultimately mean the business is reducing its investments and also earning less on what it has invested. In light of that, from a first glance at Crest Nicholson Holdings (LON:CRST), we've spotted some signs that it could be struggling, so let's investigate.
Understanding Return On Capital Employed (ROCE)
For those who don't know, ROCE is a measure of a company's yearly pre-tax profit (its return), relative to the capital employed in the business. To calculate this metric for Crest Nicholson Holdings, this is the formula:
Return on Capital Employed = Earnings Before Interest and Tax (EBIT) ÷ (Total Assets - Current Liabilities)
0.10 = UK£117m ÷ (UK£1.6b - UK£466m) (Based on the trailing twelve months to October 2021).
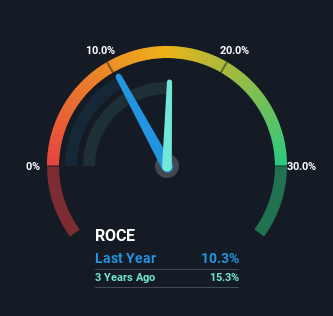
Thus, Crest Nicholson Holdings has an ROCE of 10%. That's a relatively normal return on capital, and it's around the 11% generated by the Consumer Durables industry.
View our latest analysis for Crest Nicholson Holdings
In the above chart we have measured Crest Nicholson Holdings' prior ROCE against its prior performance, but the future is arguably more important. If you're interested, you can view the analysts predictions in our free report on analyst forecasts for the company.
What The Trend Of ROCE Can Tell Us
There is reason to be cautious about Crest Nicholson Holdings, given the returns are trending downwards. Unfortunately the returns on capital have diminished from the 19% that they were earning five years ago. On top of that, it's worth noting that the amount of capital employed within the business has remained relatively steady. Companies that exhibit these attributes tend to not be shrinking, but they can be mature and facing pressure on their margins from competition. If these trends continue, we wouldn't expect Crest Nicholson Holdings to turn into a multi-bagger.
The Bottom Line
In summary, it's unfortunate that Crest Nicholson Holdings is generating lower returns from the same amount of capital. Long term shareholders who've owned the stock over the last five years have experienced a 42% depreciation in their investment, so it appears the market might not like these trends either. That being the case, unless the underlying trends revert to a more positive trajectory, we'd consider looking elsewhere.
Like most companies, Crest Nicholson Holdings does come with some risks, and we've found 3 warning signs that you should be aware of.
While Crest Nicholson Holdings isn't earning the highest return, check out this free list of companies that are earning high returns on equity with solid balance sheets.
Have feedback on this article? Concerned about the content? Get in touch with us directly. Alternatively, email editorial-team (at) simplywallst.com.
This article by Simply Wall St is general in nature. We provide commentary based on historical data and analyst forecasts only using an unbiased methodology and our articles are not intended to be financial advice. It does not constitute a recommendation to buy or sell any stock, and does not take account of your objectives, or your financial situation. We aim to bring you long-term focused analysis driven by fundamental data. Note that our analysis may not factor in the latest price-sensitive company announcements or qualitative material. Simply Wall St has no position in any stocks mentioned.
