
 Yahoo Finance
 Crawford (NYSE:CRD.B) shareholders have lost 6.9% over 3 years, earnings decline likely the culprit
Many investors define successful investing as beating the market average over the long term. But its virtually certain that sometimes you will buy stocks that fall short of the market average returns. We regret to report that long term Crawford & Company (NYSE:CRD.B) shareholders have had that experience, with the share price dropping 15% in three years, versus a market return of about 19%. The share price has dropped 24% in three months.
Given the past week has been tough on shareholders, let's investigate the fundamentals and see what we can learn.
View our latest analysis for Crawford
There is no denying that markets are sometimes efficient, but prices do not always reflect underlying business performance. By comparing earnings per share (EPS) and share price changes over time, we can get a feel for how investor attitudes to a company have morphed over time.
Crawford became profitable within the last five years. That would generally be considered a positive, so we are surprised to see the share price is down. So given the share price is down it's worth checking some other metrics too.
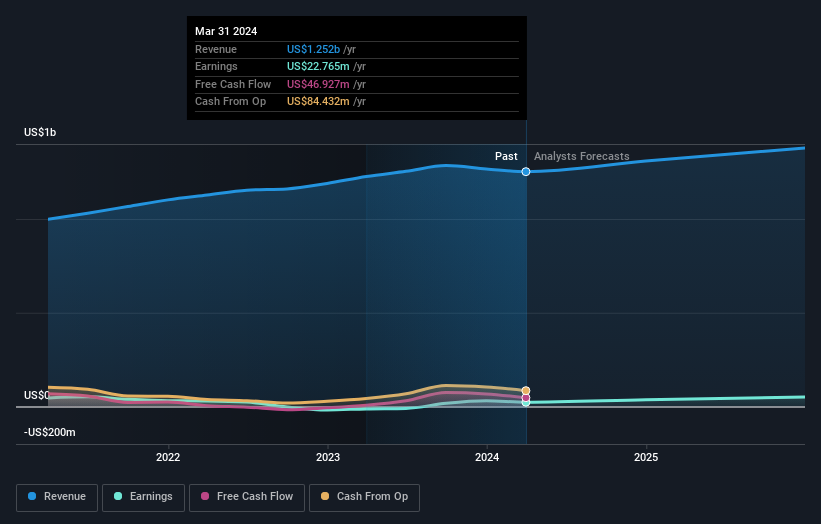
Revenue is actually up 8.1% over the three years, so the share price drop doesn't seem to hinge on revenue, either. This analysis is just perfunctory, but it might be worth researching Crawford more closely, as sometimes stocks fall unfairly. This could present an opportunity.
You can see how earnings and revenue have changed over time in the image below (click on the chart to see the exact values).
We know that Crawford has improved its bottom line lately, but what does the future have in store? This free report showing analyst forecasts should help you form a view on Crawford
What About Dividends?
When looking at investment returns, it is important to consider the difference between total shareholder return (TSR) and share price return. The TSR is a return calculation that accounts for the value of cash dividends (assuming that any dividend received was reinvested) and the calculated value of any discounted capital raisings and spin-offs. Arguably, the TSR gives a more comprehensive picture of the return generated by a stock. We note that for Crawford the TSR over the last 3 years was -6.9%, which is better than the share price return mentioned above. This is largely a result of its dividend payments!
A Different Perspective
Investors in Crawford had a tough year, with a total loss of 1.8% (including dividends), against a market gain of about 24%. However, keep in mind that even the best stocks will sometimes underperform the market over a twelve month period. On the bright side, long term shareholders have made money, with a gain of 2% per year over half a decade. If the fundamental data continues to indicate long term sustainable growth, the current sell-off could be an opportunity worth considering. It's always interesting to track share price performance over the longer term. But to understand Crawford better, we need to consider many other factors. Even so, be aware that Crawford is showing 2 warning signs in our investment analysis , you should know about...
If you would prefer to check out another company -- one with potentially superior financials -- then do not miss this free list of companies that have proven they can grow earnings.
Please note, the market returns quoted in this article reflect the market weighted average returns of stocks that currently trade on American exchanges.
Have feedback on this article? Concerned about the content? Get in touch with us directly. Alternatively, email editorial-team (at) simplywallst.com.
This article by Simply Wall St is general in nature. We provide commentary based on historical data and analyst forecasts only using an unbiased methodology and our articles are not intended to be financial advice. It does not constitute a recommendation to buy or sell any stock, and does not take account of your objectives, or your financial situation. We aim to bring you long-term focused analysis driven by fundamental data. Note that our analysis may not factor in the latest price-sensitive company announcements or qualitative material. Simply Wall St has no position in any stocks mentioned.
