
 Yahoo Finance
 Could SEEK Limited (ASX:SEK) Have The Makings Of Another Dividend Aristocrat?

Today we'll take a closer look at SEEK Limited (ASX:SEK) from a dividend investor's perspective. Owning a strong business and reinvesting the dividends is widely seen as an attractive way of growing your wealth. On the other hand, investors have been known to buy a stock because of its yield, and then lose money if the company's dividend doesn't live up to expectations.
While SEEK's 2.0% dividend yield is not the highest, we think its lengthy payment history is quite interesting. When buying stocks for their dividends, you should always run through the checks below, to see if the dividend looks sustainable.
Explore this interactive chart for our latest analysis on SEEK!
Payout ratios
Companies (usually) pay dividends out of their earnings. If a company is paying more than it earns, the dividend might have to be cut. Comparing dividend payments to a company's net profit after tax is a simple way of reality-checking whether a dividend is sustainable. SEEK paid out 90% of its profit as dividends, over the trailing twelve month period. It's paying out most of its earnings, which limits the amount that can be reinvested in the business. This may indicate limited need for further capital within the business, or highlight a commitment to paying a dividend.
In addition to comparing dividends against profits, we should inspect whether the company generated enough cash to pay its dividend. The company paid out 65% of its free cash flow, which is not bad per se, but does start to limit the amount of cash SEEK has available to meet other needs. It's positive to see that SEEK's dividend is covered by both profits and cash flow, since this is generally a sign that the dividend is sustainable, and a lower payout ratio usually suggests a greater margin of safety before the dividend gets cut.
Is SEEK's Balance Sheet Risky?
As SEEK has a meaningful amount of debt, we need to check its balance sheet to see if the company might have debt risks. A quick check of its financial situation can be done with two ratios: net debt divided by EBITDA (earnings before interest, tax, depreciation and amortisation), and net interest cover. Net debt to EBITDA is a measure of a company's total debt. Net interest cover measures the ability to meet interest payments. Essentially we check that a) the company does not have too much debt, and b) that it can afford to pay the interest. With net debt of 3.16 times its EBITDA, investors are starting to take on a meaningful amount of risk, should the business enter a downturn.
We calculated its interest cover by measuring its earnings before interest and tax (EBIT), and dividing this by the company's net interest expense. Net interest cover of 5.72 times its interest expense appears reasonable for SEEK, although we're conscious that even high interest cover doesn't make a company bulletproof.
Remember, you can always get a snapshot of SEEK's latest financial position, by checking our visualisation of its financial health.
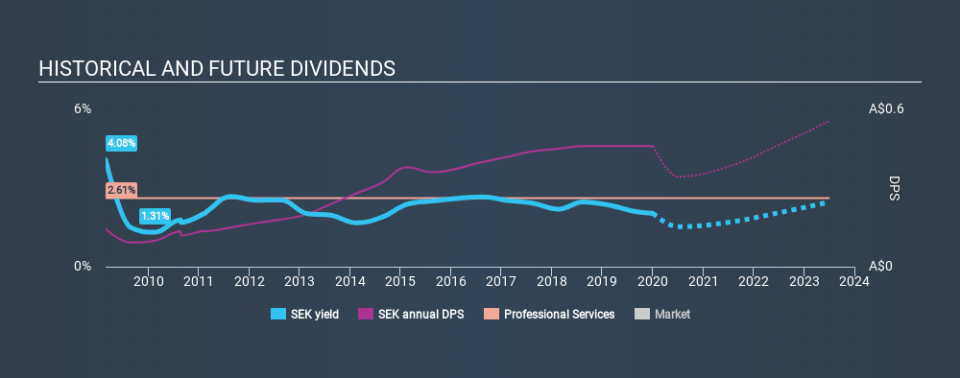
Dividend Volatility
Before buying a stock for its income, we want to see if the dividends have been stable in the past, and if the company has a track record of maintaining its dividend. For the purpose of this article, we only scrutinise the last decade of SEEK's dividend payments. Its dividend payments have fallen by 20% or more on at least one occasion over the past ten years. During the past ten-year period, the first annual payment was AU$0.14 in 2010, compared to AU$0.46 last year. This works out to be a compound annual growth rate (CAGR) of approximately 12% a year over that time. The dividends haven't grown at precisely 12% every year, but this is a useful way to average out the historical rate of growth.
It's not great to see that the payment has been cut in the past. We're generally more wary of companies that have cut their dividend before, as they tend to perform worse in an economic downturn.
Dividend Growth Potential
Given that the dividend has been cut in the past, we need to check if earnings are growing and if that might lead to stronger dividends in the future. SEEK's earnings per share have been essentially flat over the past five years. Over the long term, steady earnings per share is a risk as the value of the dividends can be reduced by inflation. SEEK's earnings per share have barely grown, which is not ideal - perhaps this is why the company pays out the majority of its earnings to shareholders. That's fine as far as it goes, but we're less enthusiastic as this often signals that the dividend is likely to grow slower in the future.
Conclusion
Dividend investors should always want to know if a) a company's dividends are affordable, b) if there is a track record of consistent payments, and c) if the dividend is capable of growing. First, we think SEEK is paying out an acceptable percentage of its cashflow and profit. Unfortunately, the company has not been able to generate earnings growth, and cut its dividend at least once in the past. In sum, we find it hard to get excited about SEEK from a dividend perspective. It's not that we think it's a bad business; just that there are other companies that perform better on these criteria.
Earnings growth generally bodes well for the future value of company dividend payments. See if the 10 SEEK analysts we track are forecasting continued growth with our free report on analyst estimates for the company.
We have also put together a list of global stocks with a market capitalisation above $1bn and yielding more 3%.
If you spot an error that warrants correction, please contact the editor at editorial-team@simplywallst.com. This article by Simply Wall St is general in nature. It does not constitute a recommendation to buy or sell any stock, and does not take account of your objectives, or your financial situation. Simply Wall St has no position in the stocks mentioned.
We aim to bring you long-term focused research analysis driven by fundamental data. Note that our analysis may not factor in the latest price-sensitive company announcements or qualitative material. Thank you for reading.
