
 Yahoo Finance
 Could The Medtronic plc (NYSE:MDT) Ownership Structure Tell Us Something Useful?

The big shareholder groups in Medtronic plc (NYSE:MDT) have power over the company. Institutions will often hold stock in bigger companies, and we expect to see insiders owning a noticeable percentage of the smaller ones. Companies that used to be publicly owned tend to have lower insider ownership.
Medtronic has a market capitalization of US$140b, so it's too big to fly under the radar. We'd expect to see both institutions and retail investors owning a portion of the company. In the chart below below, we can see that institutional investors have bought into the company. Let's take a closer look to see what the different types of shareholder can tell us about MDT.
Check out our latest analysis for Medtronic

What Does The Institutional Ownership Tell Us About Medtronic?
Institutions typically measure themselves against a benchmark when reporting to their own investors, so they often become more enthusiastic about a stock once it's included in a major index. We would expect most companies to have some institutions on the register, especially if they are growing.
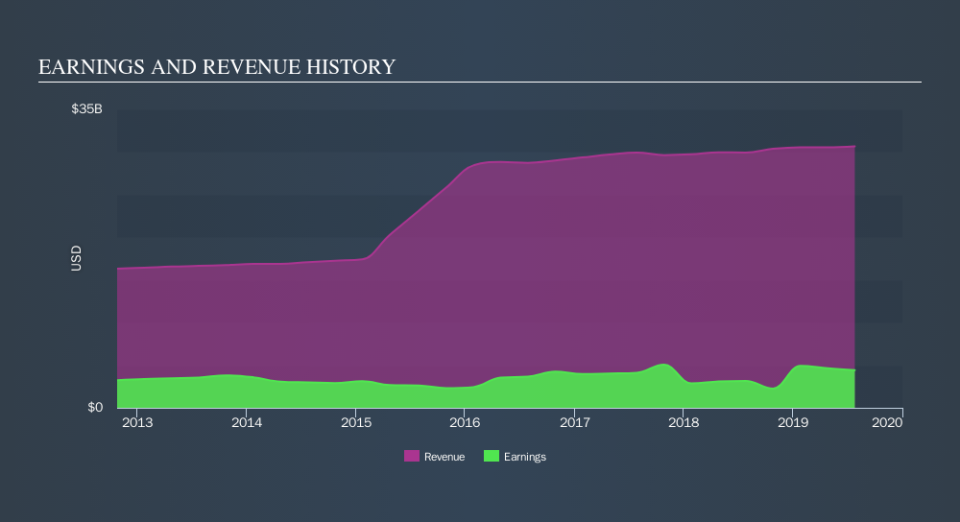
Medtronic already has institutions on the share registry. Indeed, they own 85% of the company. This can indicate that the company has a certain degree of credibility in the investment community. However, it is best to be wary of relying on the supposed validation that comes with institutional investors. They too, get it wrong sometimes. When multiple institutions own a stock, there's always a risk that they are in a 'crowded trade'. When such a trade goes wrong, multiple parties may compete to sell stock fast. This risk is higher in a company without a history of growth. You can see Medtronic's historic earnings and revenue, below, but keep in mind there's always more to the story.
Investors should note that institutions actually own more than half the company, so they can collectively wield significant power. Medtronic is not owned by hedge funds. Quite a few analysts cover the stock, so you could look into forecast growth quite easily.
Insider Ownership Of Medtronic
The definition of company insiders can be subjective, and does vary between jurisdictions. Our data reflects individual insiders, capturing board members at the very least. Company management run the business, but the CEO will answer to the board, even if he or she is a member of it.
I generally consider insider ownership to be a good thing. However, on some occasions it makes it more difficult for other shareholders to hold the board accountable for decisions.
Our most recent data indicates that insiders own less than 1% of Medtronic plc. Being so large, we would not expect insiders to own a large proportion of the stock. Collectively, they own US$155m of stock. In this sort of situation, it can be more interesting to see if those insiders have been buying or selling.
General Public Ownership
The general public, with a 15% stake in the company, will not easily be ignored. This size of ownership, while considerable, may not be enough to change company policy if the decision is not in sync with other large shareholders.
Next Steps:
While it is well worth considering the different groups that own a company, there are other factors that are even more important.
I always like to check for a history of revenue growth. You can too, by accessing this free chart of historic revenue and earnings in this detailed graph.
Ultimately the future is most important. You can access this free report on analyst forecasts for the company.
NB: Figures in this article are calculated using data from the last twelve months, which refer to the 12-month period ending on the last date of the month the financial statement is dated. This may not be consistent with full year annual report figures.
We aim to bring you long-term focused research analysis driven by fundamental data. Note that our analysis may not factor in the latest price-sensitive company announcements or qualitative material.
If you spot an error that warrants correction, please contact the editor at editorial-team@simplywallst.com. This article by Simply Wall St is general in nature. It does not constitute a recommendation to buy or sell any stock, and does not take account of your objectives, or your financial situation. Simply Wall St has no position in the stocks mentioned. Thank you for reading.
