
 Yahoo Finance
 Correlations: VIX Below 13 Percent Warns of S&P Top - But When?
Summary: The S&P 500 Volatility Index (VIX) trades below 13 percent, and such levels of complacency warn that we may be quite close to a major turning point for stocks. But when?
Correlation between the US S&P 500 and the S&P 500 Volatility Index (VIX)
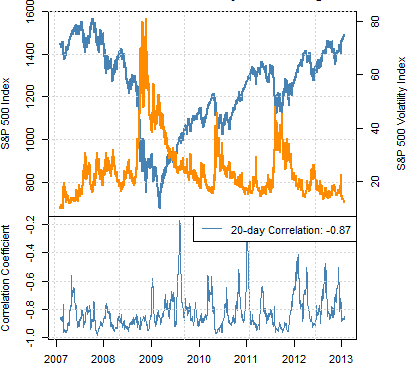
US S&P 500 (lhs)
S&P 500 Volatility Index (rhs)
Correlation between the US S&P 500 and S&P 500 Volatility Index (VIX)
The correlation between the US S&P 500 and its Volatility Index (VIX) remains sharply negative, and the fact that the VIX trades at 5-year lows helps explain why the S&P itself is near all-time highs.
The S&P 500 Volatility Index (VIX) represents the prices that traders pay for options on individual stocks. If the VIX is high, it signals that investors are willing to pay significant premiums for options—often used as insurance against sharp losses in the S&P.
Thus the fact that the VIX now trades below the psychologically significant 13 percent mark emphasizes that few fear major declines as the S&P itself trades just short of 1500. The so-called “Fear Index” has not traded below 13% since the S&P traded above 1500 in July, 2007.
Alarming levels of investor complacency warn that we may be near a significant sentiment extreme and potentially an S&P 500 top. Yet such highs are only clear in hindsight, and indeed the VIX fell as low as 9.4% in December, 2006 before doubling within three months.
We can’t know when the VIX will reverse and the S&P 500 set a significant top, but such levels of complacency warn that we are much closer to an important reversal than we are to further stock market strength.
Forex Correlations Summary
View forex correlations to the S&P 500, S&P Volatility Index (VIX), Crude Oil Futures prices, US 2-Year Treasury Yields, and Spot Gold prices.
S&P 500 | EURUSD | GBPUSD | USDJPY | AUDUSD | USDCAD | NZDUSD | USDOLLAR |
1 Week | 0.43 | -0.15 | 0.51 | 0.01 | -0.09 | -0.24 | 0.29 |
1 Month | 0.09 | 0.25 | 0.40 | 0.57 | -0.76 | 0.49 | -0.08 |
3 Month | 0.23 | 0.30 | 0.24 | 0.57 | -0.69 | 0.60 | -0.27 |
1 Year | 0.46 | 0.51 | 0.26 | 0.66 | -0.75 | 0.63 | -0.50 |
Gold | EURUSD | GBPUSD | USDJPY | AUDUSD | USDCAD | NZDUSD | USDOLLAR |
1 Week | 0.79 | 0.39 | 0.31 | 0.25 | -0.68 | -0.55 | -0.19 |
1 Month | 0.32 | 0.51 | 0.14 | 0.55 | -0.56 | 0.48 | -0.45 |
3 Month | 0.21 | 0.31 | -0.04 | 0.41 | -0.28 | 0.27 | -0.35 |
1 Year | 0.50 | 0.33 | -0.19 | 0.45 | -0.30 | 0.44 | -0.55 |
Crude Oil | EURUSD | GBPUSD | USDJPY | AUDUSD | USDCAD | NZDUSD | USDOLLAR |
1 Week | 0.87 | 0.34 | 0.61 | 0.06 | -0.55 | -0.41 | 0.07 |
1 Month | 0.35 | 0.30 | 0.50 | 0.45 | -0.36 | 0.31 | -0.13 |
3 Month | 0.39 | 0.29 | 0.20 | 0.39 | -0.31 | 0.33 | -0.28 |
1 Year | 0.46 | 0.44 | 0.16 | 0.54 | -0.59 | 0.49 | -0.47 |
US 2yr Yield | EURUSD | GBPUSD | USDJPY | AUDUSD | USDCAD | NZDUSD | USDOLLAR |
1 Week | 0.90 | 0.26 | 0.79 | -0.29 | -0.43 | -0.83 | 0.28 |
1 Month | 0.28 | 0.10 | 0.43 | 0.10 | -0.37 | -0.20 | 0.08 |
3 Month | 0.23 | 0.14 | 0.39 | 0.10 | -0.38 | 0.01 | 0.03 |
1 Year | 0.18 | 0.10 | 0.41 | 0.09 | -0.24 | 0.01 | 0.02 |
S&P VIX | EURUSD | GBPUSD | USDJPY | AUDUSD | USDCAD | NZDUSD | USDOLLAR |
1 Week | 0.74 | 0.92 | 0.00 | 0.39 | -0.93 | -0.07 | -0.60 |
1 Month | 0.10 | -0.09 | -0.27 | -0.37 | 0.59 | -0.47 | -0.07 |
3 Month | 0.02 | -0.11 | -0.14 | -0.40 | 0.50 | -0.49 | 0.10 |
1 Year | -0.38 | -0.41 | -0.20 | -0.58 | 0.60 | -0.58 | 0.43 |
Perfect Positive Correlation: | 1.00 | ||||||
Perfect Negative Correlation: | -1.00 | ||||||
--- Written by David Rodriguez, Quantitative Strategist for DailyFX.com
Receive future correlation studies and other reports via this author’s e-mail distribution list with this link.
Contact David and follow via Facebook and Twitter:
http://www.facebook.com/DRodriguezFX
https://twitter.com/DRodriguezFX
DailyFX provides forex news and technical analysis on the trends that influence the global currency markets.
Learn forex trading with a free practice account and trading charts from FXCM.
