
 Yahoo Finance
 Is Service Corporation International (NYSE:SCI) A Smart Pick For Income Investors?

Dividend paying stocks like Service Corporation International (NYSE:SCI) tend to be popular with investors, and for good reason - some research suggests a significant amount of all stock market returns come from reinvested dividends. Unfortunately, it's common for investors to be enticed in by the seemingly attractive yield, and lose money when the company has to cut its dividend payments.
A 1.6% yield is nothing to get excited about, but investors probably think the long payment history suggests Service International has some staying power. When buying stocks for their dividends, you should always run through the checks below, to see if the dividend looks sustainable.
Click the interactive chart for our full dividend analysis
Payout ratios
Dividends are usually paid out of company earnings. If a company is paying more than it earns, then the dividend might become unsustainable - hardly an ideal situation. So we need to form a view on if a company's dividend is sustainable, relative to its net profit after tax. Looking at the data, we can see that 31% of Service International's profits were paid out as dividends in the last 12 months. A medium payout ratio strikes a good balance between paying dividends, and keeping enough back to invest in the business. Besides, if reinvestment opportunities dry up, the company has room to increase the dividend.
We also measure dividends paid against a company's levered free cash flow, to see if enough cash was generated to cover the dividend. Of the free cash flow it generated last year, Service International paid out 40% as dividends, suggesting the dividend is affordable. It's encouraging to see that the dividend is covered by both profit and cash flow. This generally suggests the dividend is sustainable, as long as earnings don't drop precipitously.
Is Service International's Balance Sheet Risky?
As Service International has a meaningful amount of debt, we need to check its balance sheet to see if the company might have debt risks. A quick check of its financial situation can be done with two ratios: net debt divided by EBITDA (earnings before interest, tax, depreciation and amortisation), and net interest cover. Net debt to EBITDA measures total debt load relative to company earnings (lower = less debt), while net interest cover measures the ability to pay interest on the debt (higher = greater ability to pay interest costs). Service International is carrying net debt of 3.92 times its EBITDA, which is getting towards the upper limit of our comfort range on a dividend stock that the investor hopes will endure a wide range of economic circumstances.
Net interest cover can be calculated by dividing earnings before interest and tax (EBIT) by the company's net interest expense. Interest cover of 3.28 times its interest expense is starting to become a concern for Service International, and be aware that lenders may place additional restrictions on the company as well.
Consider getting our latest analysis on Service International's financial position here.
Dividend Volatility
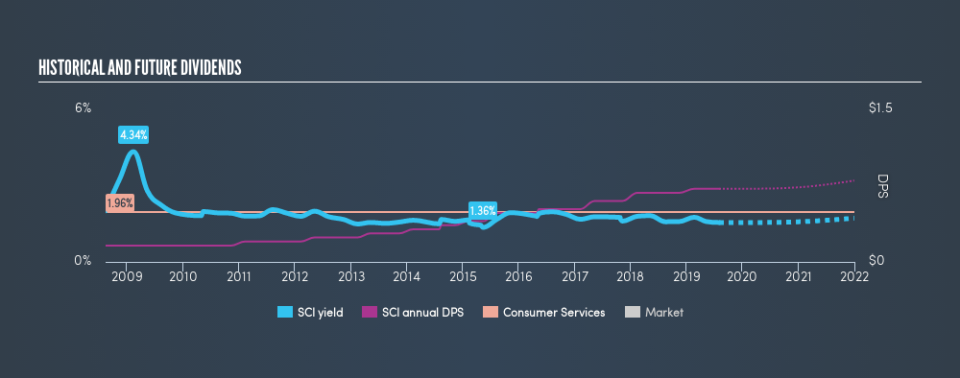
From the perspective of an income investor who wants to earn dividends for many years, there is not much point buying a stock if its dividend is regularly cut or is not reliable. For the purpose of this article, we only scrutinise the last decade of Service International's dividend payments. The dividend has been stable over the past 10 years, which is great. We think this could suggest some resilience to the business and its dividends. During the past ten-year period, the first annual payment was US$0.16 in 2009, compared to US$0.72 last year. Dividends per share have grown at approximately 16% per year over this time.
Dividends have been growing pretty quickly, and even more impressively, they haven't experienced any notable falls during this period.
Dividend Growth Potential
Dividend payments have been consistent over the past few years, but we should always check if earnings per share (EPS) are growing, as this will help maintain the purchasing power of the dividend. Strong earnings per share (EPS) growth might encourage our interest in the company despite fluctuating dividends, which is why it's great to see Service International has grown its earnings per share at 27% per annum over the past five years. With high earnings per share growth in recent times and a modest payout ratio, we think this is an attractive combination if earnings can be reinvested to generate further growth.
Conclusion
To summarise, shareholders should always check that Service International's dividends are affordable, that its dividend payments are relatively stable, and that it has decent prospects for growing its earnings and dividend. It's great to see that Service International is paying out a low percentage of its earnings and cash flow. It hasn't demonstrated a strong ability to grow earnings per share, but we like that the dividend payments have been fairly consistent. Overall, we think there are a lot of positives to Service International from a dividend perspective.
Earnings growth generally bodes well for the future value of company dividend payments. See if the 4 Service International analysts we track are forecasting continued growth with our free report on analyst estimates for the company.
Looking for more high-yielding dividend ideas? Try our curated list of dividend stocks with a yield above 3%.
We aim to bring you long-term focused research analysis driven by fundamental data. Note that our analysis may not factor in the latest price-sensitive company announcements or qualitative material.
If you spot an error that warrants correction, please contact the editor at editorial-team@simplywallst.com. This article by Simply Wall St is general in nature. It does not constitute a recommendation to buy or sell any stock, and does not take account of your objectives, or your financial situation. Simply Wall St has no position in the stocks mentioned. Thank you for reading.
