
 Yahoo Finance
 Corcept Therapeutics' (NASDAQ:CORT) 27% CAGR outpaced the company's earnings growth over the same five-year period
When you buy shares in a company, it's worth keeping in mind the possibility that it could fail, and you could lose your money. But on the bright side, if you buy shares in a high quality company at the right price, you can gain well over 100%. For example, the Corcept Therapeutics Incorporated (NASDAQ:CORT) share price has soared 225% in the last half decade. Most would be very happy with that. It's even up 6.6% in the last week.
The past week has proven to be lucrative for Corcept Therapeutics investors, so let's see if fundamentals drove the company's five-year performance.
Check out our latest analysis for Corcept Therapeutics
While markets are a powerful pricing mechanism, share prices reflect investor sentiment, not just underlying business performance. One imperfect but simple way to consider how the market perception of a company has shifted is to compare the change in the earnings per share (EPS) with the share price movement.
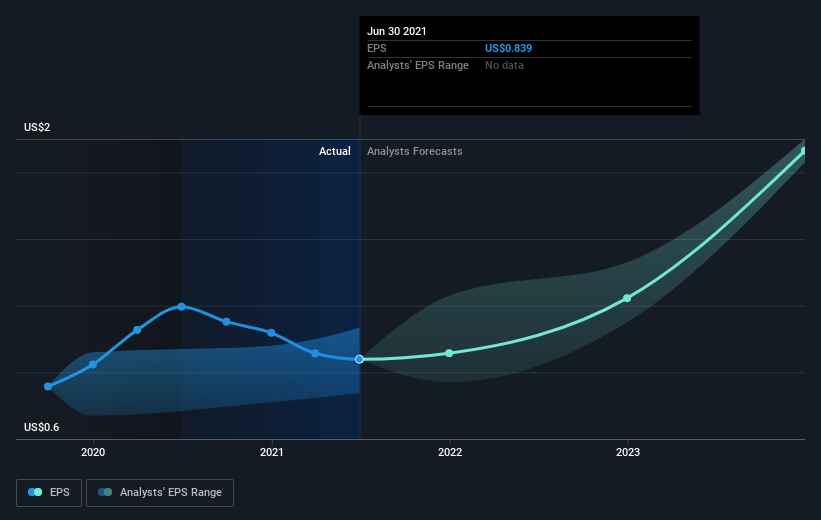
Over half a decade, Corcept Therapeutics managed to grow its earnings per share at 134% a year. This EPS growth is higher than the 27% average annual increase in the share price. So one could conclude that the broader market has become more cautious towards the stock.
The image below shows how EPS has tracked over time (if you click on the image you can see greater detail).
We consider it positive that insiders have made significant purchases in the last year. Having said that, most people consider earnings and revenue growth trends to be a more meaningful guide to the business. It might be well worthwhile taking a look at our free report on Corcept Therapeutics' earnings, revenue and cash flow.
A Different Perspective
Corcept Therapeutics shareholders gained a total return of 14% during the year. But that return falls short of the market. On the bright side, the longer term returns (running at about 27% a year, over half a decade) look better. It's quite possible the business continues to execute with prowess, even as the share price gains are slowing. It's always interesting to track share price performance over the longer term. But to understand Corcept Therapeutics better, we need to consider many other factors. To that end, you should be aware of the 1 warning sign we've spotted with Corcept Therapeutics .
Corcept Therapeutics is not the only stock that insiders are buying. For those who like to find winning investments this free list of growing companies with recent insider purchasing, could be just the ticket.
Please note, the market returns quoted in this article reflect the market weighted average returns of stocks that currently trade on US exchanges.
This article by Simply Wall St is general in nature. We provide commentary based on historical data and analyst forecasts only using an unbiased methodology and our articles are not intended to be financial advice. It does not constitute a recommendation to buy or sell any stock, and does not take account of your objectives, or your financial situation. We aim to bring you long-term focused analysis driven by fundamental data. Note that our analysis may not factor in the latest price-sensitive company announcements or qualitative material. Simply Wall St has no position in any stocks mentioned.
Have feedback on this article? Concerned about the content? Get in touch with us directly. Alternatively, email editorial-team (at) simplywallst.com.
