
 Yahoo Finance
 Is Connexion Telematics Ltd’s (ASX:CXZ) Balance Sheet A Threat To Its Future?

While small-cap stocks, such as Connexion Telematics Ltd (ASX:CXZ) with its market cap of AU$9.3m, are popular for their explosive growth, investors should also be aware of their balance sheet to judge whether the company can survive a downturn. Given that CXZ is not presently profitable, it’s crucial to understand the current state of its operations and pathway to profitability. Let’s work through some financial health checks you may wish to consider if you’re interested in this stock. However, this is just a partial view of the stock, and I recommend you dig deeper yourself into CXZ here.
CXZ’s Debt (And Cash Flows)
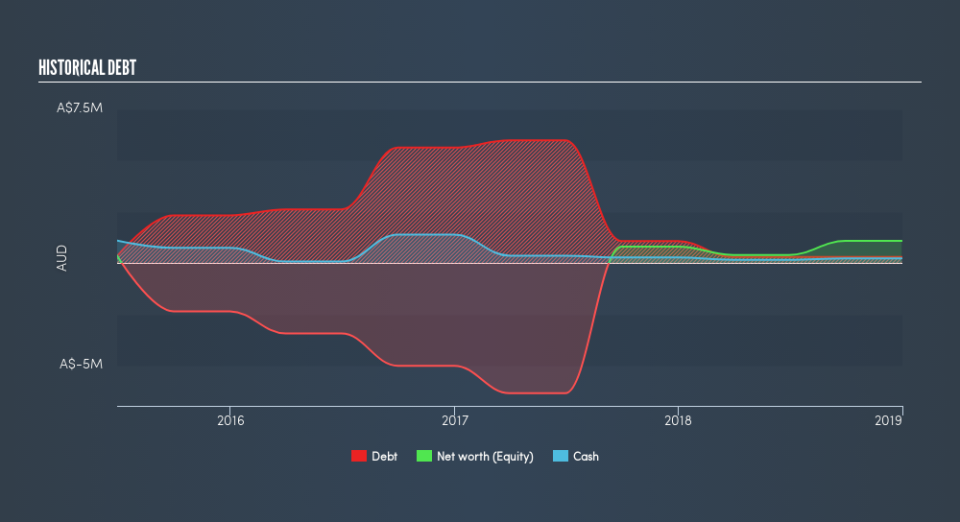
CXZ has shrunk its total debt levels in the last twelve months, from AU$1.1m to AU$300k . With this reduction in debt, CXZ currently has AU$236k remaining in cash and short-term investments to keep the business going. Additionally, CXZ has produced AU$573k in operating cash flow in the last twelve months, leading to an operating cash to total debt ratio of 191%, indicating that CXZ’s current level of operating cash is high enough to cover debt.
Does CXZ’s liquid assets cover its short-term commitments?
At the current liabilities level of AU$721k, it appears that the company has been able to meet these obligations given the level of current assets of AU$1.0m, with a current ratio of 1.43x. The current ratio is calculated by dividing current assets by current liabilities. Generally, for Software companies, this is a reasonable ratio as there’s enough of a cash buffer without holding too much capital in low return investments.
Can CXZ service its debt comfortably?
With a debt-to-equity ratio of 28%, CXZ’s debt level may be seen as prudent. This range is considered safe as CXZ is not taking on too much debt obligation, which may be constraining for future growth. Investors’ risk associated with debt is very low with CXZ, and the company has plenty of headroom and ability to raise debt should it need to in the future.
Next Steps:
CXZ’s high cash coverage and appropriate debt levels indicate its ability to utilise its borrowings efficiently in order to generate ample cash flow. In addition to this, the company will be able to pay all of its upcoming liabilities from its current short-term assets. Keep in mind I haven’t considered other factors such as how CXZ has been performing in the past. I recommend you continue to research Connexion Telematics to get a more holistic view of the stock by looking at:
Valuation: What is CXZ worth today? Is the stock undervalued, even when its growth outlook is factored into its intrinsic value? The intrinsic value infographic in our free research report helps visualize whether CXZ is currently mispriced by the market.
Historical Performance: What has CXZ’s returns been like over the past? Go into more detail in the past track record analysis and take a look at the free visual representations of our analysis for more clarity.
Other High-Performing Stocks: Are there other stocks that provide better prospects with proven track records? Explore our free list of these great stocks here.
We aim to bring you long-term focused research analysis driven by fundamental data. Note that our analysis may not factor in the latest price-sensitive company announcements or qualitative material.
If you spot an error that warrants correction, please contact the editor at editorial-team@simplywallst.com. This article by Simply Wall St is general in nature. It does not constitute a recommendation to buy or sell any stock, and does not take account of your objectives, or your financial situation. Simply Wall St has no position in the stocks mentioned. Thank you for reading.
