
 Yahoo Finance
 Companies Like Rhythm Biosciences (ASX:RHY) Are In A Position To Invest In Growth
Even when a business is losing money, it's possible for shareholders to make money if they buy a good business at the right price. For example, biotech and mining exploration companies often lose money for years before finding success with a new treatment or mineral discovery. But while history lauds those rare successes, those that fail are often forgotten; who remembers Pets.com?
So should Rhythm Biosciences (ASX:RHY) shareholders be worried about its cash burn? For the purpose of this article, we'll define cash burn as the amount of cash the company is spending each year to fund its growth (also called its negative free cash flow). Let's start with an examination of the business' cash, relative to its cash burn.
Check out our latest analysis for Rhythm Biosciences
When Might Rhythm Biosciences Run Out Of Money?
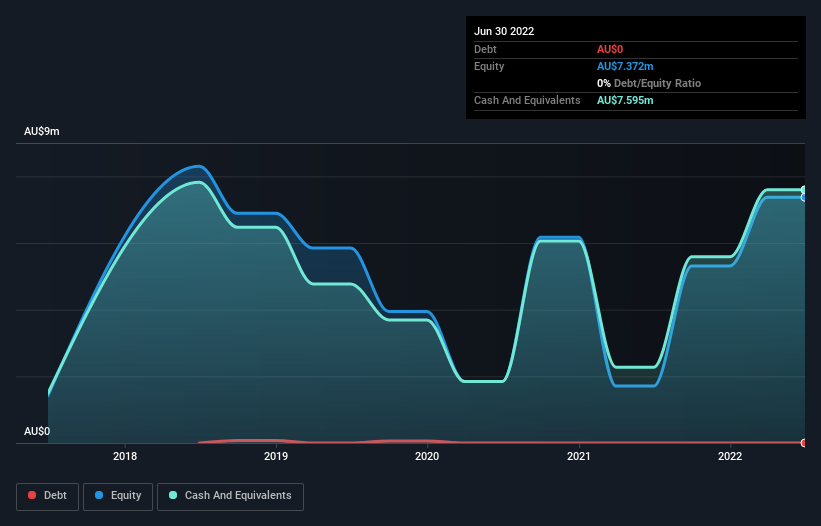
You can calculate a company's cash runway by dividing the amount of cash it has by the rate at which it is spending that cash. As at June 2022, Rhythm Biosciences had cash of AU$7.6m and no debt. In the last year, its cash burn was AU$6.5m. That means it had a cash runway of around 14 months as of June 2022. That's not too bad, but it's fair to say the end of the cash runway is in sight, unless cash burn reduces drastically. The image below shows how its cash balance has been changing over the last few years.
How Is Rhythm Biosciences' Cash Burn Changing Over Time?
In the last year, Rhythm Biosciences did book revenue of AU$2.4m, but its revenue from operations was less, at just AU$652k. Given how low that operating leverage is, we think it's too early to put much weight on the revenue growth, so we'll focus on how the cash burn is changing, instead. With the cash burn rate up 19% in the last year, it seems that the company is ratcheting up investment in the business over time. However, the company's true cash runway will therefore be shorter than suggested above, if spending continues to increase. Admittedly, we're a bit cautious of Rhythm Biosciences due to its lack of significant operating revenues. We prefer most of the stocks on this list of stocks that analysts expect to grow.
How Easily Can Rhythm Biosciences Raise Cash?
Given its cash burn trajectory, Rhythm Biosciences shareholders may wish to consider how easily it could raise more cash, despite its solid cash runway. Issuing new shares, or taking on debt, are the most common ways for a listed company to raise more money for its business. Commonly, a business will sell new shares in itself to raise cash and drive growth. We can compare a company's cash burn to its market capitalisation to get a sense for how many new shares a company would have to issue to fund one year's operations.
Since it has a market capitalisation of AU$288m, Rhythm Biosciences' AU$6.5m in cash burn equates to about 2.3% of its market value. So it could almost certainly just borrow a little to fund another year's growth, or else easily raise the cash by issuing a few shares.
So, Should We Worry About Rhythm Biosciences' Cash Burn?
Even though its increasing cash burn makes us a little nervous, we are compelled to mention that we thought Rhythm Biosciences' cash burn relative to its market cap was relatively promising. While we're the kind of investors who are always a bit concerned about the risks involved with cash burning companies, the metrics we have discussed in this article leave us relatively comfortable about Rhythm Biosciences' situation. On another note, Rhythm Biosciences has 3 warning signs (and 1 which is a bit unpleasant) we think you should know about.
If you would prefer to check out another company with better fundamentals, then do not miss this free list of interesting companies, that have HIGH return on equity and low debt or this list of stocks which are all forecast to grow.
Have feedback on this article? Concerned about the content? Get in touch with us directly. Alternatively, email editorial-team (at) simplywallst.com.
This article by Simply Wall St is general in nature. We provide commentary based on historical data and analyst forecasts only using an unbiased methodology and our articles are not intended to be financial advice. It does not constitute a recommendation to buy or sell any stock, and does not take account of your objectives, or your financial situation. We aim to bring you long-term focused analysis driven by fundamental data. Note that our analysis may not factor in the latest price-sensitive company announcements or qualitative material. Simply Wall St has no position in any stocks mentioned.
Join A Paid User Research Session
You’ll receive a US$30 Amazon Gift card for 1 hour of your time while helping us build better investing tools for the individual investors like yourself. Sign up here
