Companies Like Ardiden (ASX:ADV) Can Be Considered Quite Risky

Even when a business is losing money, it's possible for shareholders to make money if they buy a good business at the right price. For example, although software-as-a-service business Salesforce.com lost money for years while it grew recurring revenue, if you held shares since 2005, you'd have done very well indeed. But while history lauds those rare successes, those that fail are often forgotten; who remembers Pets.com?
So should Ardiden (ASX:ADV) shareholders be worried about its cash burn? In this article, we define cash burn as its annual (negative) free cash flow, which is the amount of money a company spends each year to fund its growth. We'll start by comparing its cash burn with its cash reserves in order to calculate its cash runway.
See our latest analysis for Ardiden
When Might Ardiden Run Out Of Money?
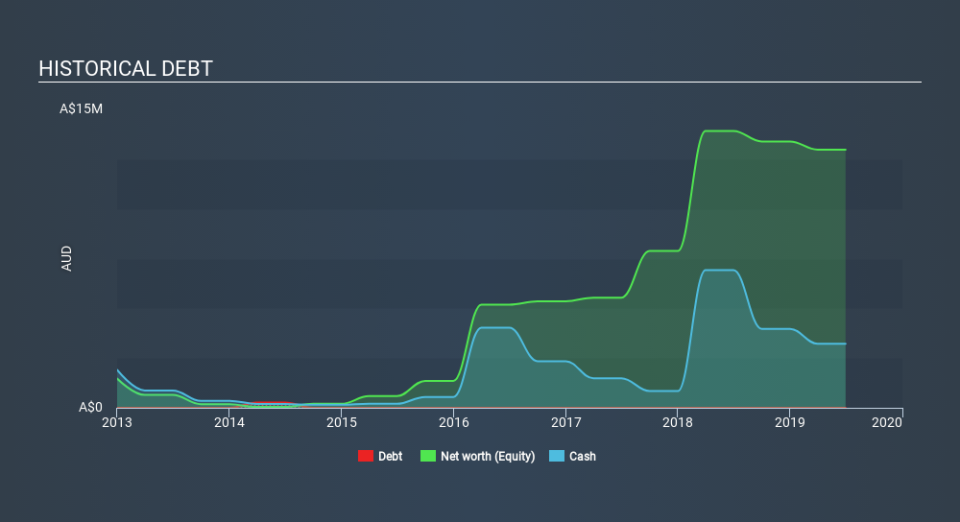
You can calculate a company's cash runway by dividing the amount of cash it has by the rate at which it is spending that cash. When Ardiden last reported its balance sheet in June 2019, it had zero debt and cash worth AU$3.2m. In the last year, its cash burn was AU$3.7m. So it had a cash runway of approximately 10 months from June 2019. That's quite a short cash runway, indicating the company must either reduce its annual cash burn or replenish its cash. You can see how its cash balance has changed over time in the image below.
How Is Ardiden's Cash Burn Changing Over Time?
Ardiden didn't record any revenue over the last year, indicating that it's an early stage company still developing its business. Nonetheless, we can still examine its cash burn trajectory as part of our assessment of its cash burn situation. Given the length of the cash runway, we'd interpret the 29% reduction in cash burn, in twelve months, as prudent if not necessary for capital preservation. Ardiden makes us a little nervous due to its lack of substantial operating revenue. So we'd generally prefer stocks from this list of stocks that have analysts forecasting growth.
Can Ardiden Raise More Cash Easily?
Even though it has reduced its cash burn recently, shareholders should still consider how easy it would be for Ardiden to raise more cash in the future. Generally speaking, a listed business can raise new cash through issuing shares or taking on debt. Many companies end up issuing new shares to fund future growth. By comparing a company's annual cash burn to its total market capitalisation, we can estimate roughly how many shares it would have to issue in order to run the company for another year (at the same burn rate).
Since it has a market capitalisation of AU$5.1m, Ardiden's AU$3.7m in cash burn equates to about 73% of its market value. Given how large that cash burn is, relative to the market value of the entire company, we'd consider it to be a high risk stock, with the real possibility of extreme dilution.
How Risky Is Ardiden's Cash Burn Situation?
On this analysis of Ardiden's cash burn, we think its cash burn reduction was reassuring, while its cash burn relative to its market cap has us a bit worried. After looking at that range of measures, we think shareholders should be extremely attentive to how the company is using its cash, as the cash burn makes us uncomfortable. While it's important to consider hard data like the metrics discussed above, many investors would also be interested to note that Ardiden insiders have been trading shares in the company. Click here to find out if they have been buying or selling.
Of course, you might find a fantastic investment by looking elsewhere. So take a peek at this free list of companies insiders are buying, and this list of stocks growth stocks (according to analyst forecasts)
If you spot an error that warrants correction, please contact the editor at editorial-team@simplywallst.com. This article by Simply Wall St is general in nature. It does not constitute a recommendation to buy or sell any stock, and does not take account of your objectives, or your financial situation. Simply Wall St has no position in the stocks mentioned.
We aim to bring you long-term focused research analysis driven by fundamental data. Note that our analysis may not factor in the latest price-sensitive company announcements or qualitative material. Thank you for reading.

 Yahoo Finance
