
 Yahoo Finance
 Commonwealth Bank of Australia (ASX:CBA) Share Prices Have Dropped 16% In The Last Year

Investors can approximate the average market return by buying an index fund. But if you buy individual stocks, you can do both better or worse than that. Unfortunately the Commonwealth Bank of Australia (ASX:CBA) share price slid 16% over twelve months. That's disappointing when you consider the market declined 6.5%. However, the longer term returns haven't been so bad, with the stock down 8.9% in the last three years. There was little comfort for shareholders in the last week as the price declined a further 3.4%.
Check out our latest analysis for Commonwealth Bank of Australia
In his essay The Superinvestors of Graham-and-Doddsville Warren Buffett described how share prices do not always rationally reflect the value of a business. One imperfect but simple way to consider how the market perception of a company has shifted is to compare the change in the earnings per share (EPS) with the share price movement.
Unfortunately Commonwealth Bank of Australia reported an EPS drop of 8.0% for the last year. The share price decline of 16% is actually more than the EPS drop. This suggests the EPS fall has made some shareholders are more nervous about the business.
The company's earnings per share (over time) is depicted in the image below (click to see the exact numbers).
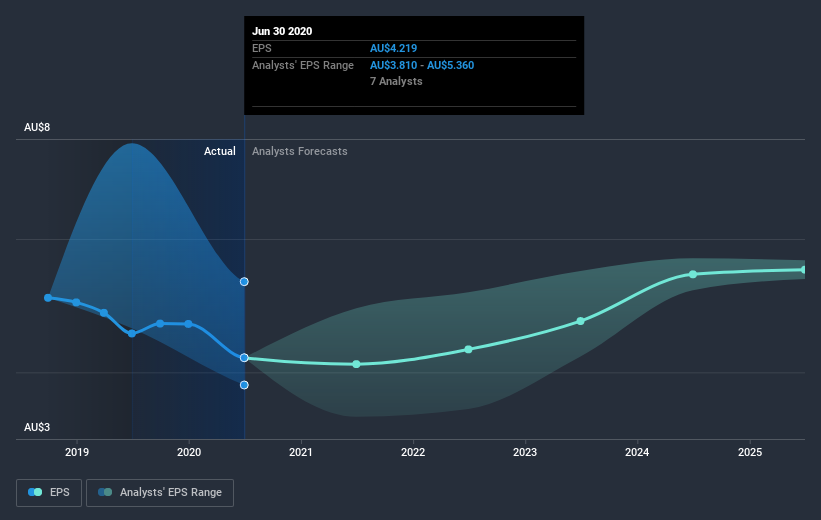
We like that insiders have been buying shares in the last twelve months. Having said that, most people consider earnings and revenue growth trends to be a more meaningful guide to the business. Dive deeper into the earnings by checking this interactive graph of Commonwealth Bank of Australia's earnings, revenue and cash flow.
What About Dividends?
It is important to consider the total shareholder return, as well as the share price return, for any given stock. The TSR is a return calculation that accounts for the value of cash dividends (assuming that any dividend received was reinvested) and the calculated value of any discounted capital raisings and spin-offs. So for companies that pay a generous dividend, the TSR is often a lot higher than the share price return. As it happens, Commonwealth Bank of Australia's TSR for the last year was -13%, which exceeds the share price return mentioned earlier. This is largely a result of its dividend payments!
A Different Perspective
We regret to report that Commonwealth Bank of Australia shareholders are down 13% for the year (even including dividends). Unfortunately, that's worse than the broader market decline of 6.5%. Having said that, it's inevitable that some stocks will be oversold in a falling market. The key is to keep your eyes on the fundamental developments. On the bright side, long term shareholders have made money, with a gain of 2.9% per year over half a decade. It could be that the recent sell-off is an opportunity, so it may be worth checking the fundamental data for signs of a long term growth trend. I find it very interesting to look at share price over the long term as a proxy for business performance. But to truly gain insight, we need to consider other information, too. For instance, we've identified 1 warning sign for Commonwealth Bank of Australia that you should be aware of.
Commonwealth Bank of Australia is not the only stock that insiders are buying. For those who like to find winning investments this free list of growing companies with recent insider purchasing, could be just the ticket.
Please note, the market returns quoted in this article reflect the market weighted average returns of stocks that currently trade on AU exchanges.
This article by Simply Wall St is general in nature. It does not constitute a recommendation to buy or sell any stock, and does not take account of your objectives, or your financial situation. We aim to bring you long-term focused analysis driven by fundamental data. Note that our analysis may not factor in the latest price-sensitive company announcements or qualitative material. Simply Wall St has no position in any stocks mentioned.
Have feedback on this article? Concerned about the content? Get in touch with us directly. Alternatively, email editorial-team@simplywallst.com.
