
 Yahoo Finance
 What Is Comerica's (NYSE:CMA) P/E Ratio After Its Share Price Tanked?

To the annoyance of some shareholders, Comerica (NYSE:CMA) shares are down a considerable 42% in the last month. Indeed the recent decline has arguably caused some bitterness for shareholders who have held through the 56% drop over twelve months.
Assuming nothing else has changed, a lower share price makes a stock more attractive to potential buyers. In the long term, share prices tend to follow earnings per share, but in the short term prices bounce around in response to short term factors (which are not always obvious). So, on certain occasions, long term focussed investors try to take advantage of pessimistic expectations to buy shares at a better price. Perhaps the simplest way to get a read on investors' expectations of a business is to look at its Price to Earnings Ratio (PE Ratio). A high P/E implies that investors have high expectations of what a company can achieve compared to a company with a low P/E ratio.
Check out our latest analysis for Comerica
How Does Comerica's P/E Ratio Compare To Its Peers?
We can tell from its P/E ratio of 4.53 that sentiment around Comerica isn't particularly high. We can see in the image below that the average P/E (10.5) for companies in the banks industry is higher than Comerica's P/E.
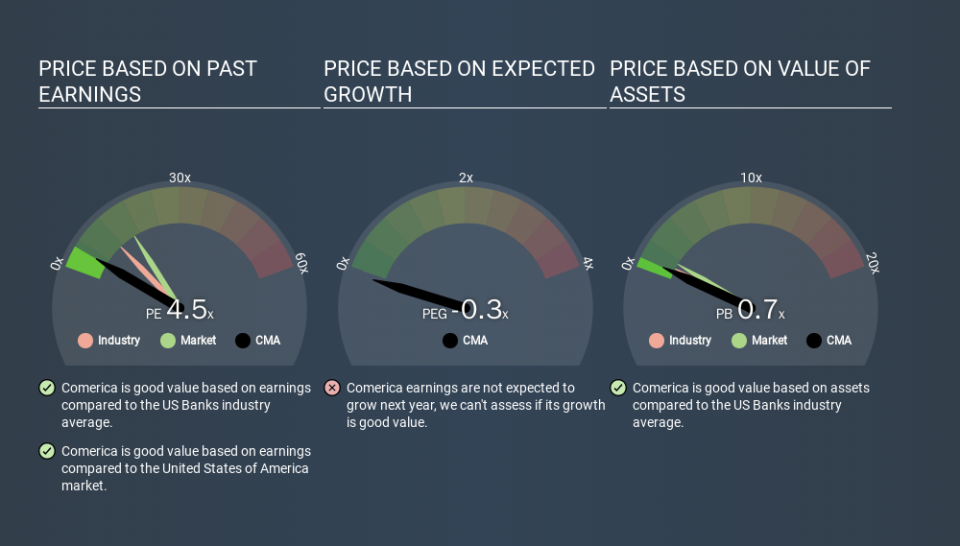
Its relatively low P/E ratio indicates that Comerica shareholders think it will struggle to do as well as other companies in its industry classification. While current expectations are low, the stock could be undervalued if the situation is better than the market assumes. It is arguably worth checking if insiders are buying shares, because that might imply they believe the stock is undervalued.
How Growth Rates Impact P/E Ratios
Earnings growth rates have a big influence on P/E ratios. That's because companies that grow earnings per share quickly will rapidly increase the 'E' in the equation. Therefore, even if you pay a high multiple of earnings now, that multiple will become lower in the future. Then, a lower P/E should attract more buyers, pushing the share price up.
Comerica saw earnings per share improve by -8.7% last year. And earnings per share have improved by 19% annually, over the last five years.
A Limitation: P/E Ratios Ignore Debt and Cash In The Bank
It's important to note that the P/E ratio considers the market capitalization, not the enterprise value. Thus, the metric does not reflect cash or debt held by the company. The exact same company would hypothetically deserve a higher P/E ratio if it had a strong balance sheet, than if it had a weak one with lots of debt, because a cashed up company can spend on growth.
Such expenditure might be good or bad, in the long term, but the point here is that the balance sheet is not reflected by this ratio.
How Does Comerica's Debt Impact Its P/E Ratio?
Comerica's net debt equates to 38% of its market capitalization. While it's worth keeping this in mind, it isn't a worry.
The Bottom Line On Comerica's P/E Ratio
Comerica has a P/E of 4.5. That's below the average in the US market, which is 15.1. The company does have a little debt, and EPS is moving in the right direction. If growth is sustainable over the long term, then the current P/E ratio may be a sign of good value. Given Comerica's P/E ratio has declined from 7.8 to 4.5 in the last month, we know for sure that the market is more worried about the business today, than it was back then. For those who prefer to invest with the flow of momentum, that might be a bad sign, but for deep value investors this stock might justify some research.
Investors should be looking to buy stocks that the market is wrong about. As value investor Benjamin Graham famously said, 'In the short run, the market is a voting machine but in the long run, it is a weighing machine. So this free visual report on analyst forecasts could hold the key to an excellent investment decision.
You might be able to find a better buy than Comerica. If you want a selection of possible winners, check out this free list of interesting companies that trade on a P/E below 20 (but have proven they can grow earnings).
If you spot an error that warrants correction, please contact the editor at editorial-team@simplywallst.com. This article by Simply Wall St is general in nature. It does not constitute a recommendation to buy or sell any stock, and does not take account of your objectives, or your financial situation. Simply Wall St has no position in the stocks mentioned.
We aim to bring you long-term focused research analysis driven by fundamental data. Note that our analysis may not factor in the latest price-sensitive company announcements or qualitative material. Thank you for reading.
