
 Yahoo Finance
 Is The Colonial Motor Company Limited's (NZSE:CMO) Recent Stock Performance Influenced By Its Financials In Any Way?
Colonial Motor's (NZSE:CMO) stock up by 1.2% over the past three months. We wonder if and what role the company's financials play in that price change as a company's long-term fundamentals usually dictate market outcomes. In this article, we decided to focus on Colonial Motor's ROE.
Return on Equity or ROE is a test of how effectively a company is growing its value and managing investors’ money. In simpler terms, it measures the profitability of a company in relation to shareholder's equity.
View our latest analysis for Colonial Motor
How Do You Calculate Return On Equity?
The formula for return on equity is:
Return on Equity = Net Profit (from continuing operations) ÷ Shareholders' Equity
So, based on the above formula, the ROE for Colonial Motor is:
8.1% = NZ$25m ÷ NZ$309m (Based on the trailing twelve months to December 2023).
The 'return' is the yearly profit. One way to conceptualize this is that for each NZ$1 of shareholders' capital it has, the company made NZ$0.08 in profit.
Why Is ROE Important For Earnings Growth?
Thus far, we have learned that ROE measures how efficiently a company is generating its profits. Based on how much of its profits the company chooses to reinvest or "retain", we are then able to evaluate a company's future ability to generate profits. Assuming everything else remains unchanged, the higher the ROE and profit retention, the higher the growth rate of a company compared to companies that don't necessarily bear these characteristics.
A Side By Side comparison of Colonial Motor's Earnings Growth And 8.1% ROE
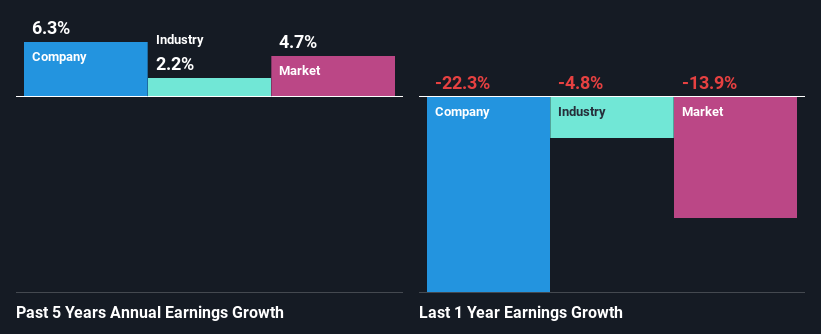
On the face of it, Colonial Motor's ROE is not much to talk about. Next, when compared to the average industry ROE of 12%, the company's ROE leaves us feeling even less enthusiastic. Colonial Motor was still able to see a decent net income growth of 6.3% over the past five years. So, there might be other aspects that are positively influencing the company's earnings growth. For example, it is possible that the company's management has made some good strategic decisions, or that the company has a low payout ratio.
We then compared Colonial Motor's net income growth with the industry and we're pleased to see that the company's growth figure is higher when compared with the industry which has a growth rate of 2.2% in the same 5-year period.
Earnings growth is a huge factor in stock valuation. It’s important for an investor to know whether the market has priced in the company's expected earnings growth (or decline). By doing so, they will have an idea if the stock is headed into clear blue waters or if swampy waters await. Has the market priced in the future outlook for CMO? You can find out in our latest intrinsic value infographic research report
Is Colonial Motor Efficiently Re-investing Its Profits?
The high three-year median payout ratio of 67% (or a retention ratio of 33%) for Colonial Motor suggests that the company's growth wasn't really hampered despite it returning most of its income to its shareholders.
Additionally, Colonial Motor has paid dividends over a period of at least ten years which means that the company is pretty serious about sharing its profits with shareholders.
Conclusion
On the whole, we do feel that Colonial Motor has some positive attributes. While no doubt its earnings growth is pretty substantial, we do feel that the reinvestment rate is pretty low, meaning, the earnings growth number could have been significantly higher had the company been retaining more of its profits. Up till now, we've only made a short study of the company's growth data. So it may be worth checking this free detailed graph of Colonial Motor's past earnings, as well as revenue and cash flows to get a deeper insight into the company's performance.
Have feedback on this article? Concerned about the content? Get in touch with us directly. Alternatively, email editorial-team (at) simplywallst.com.
This article by Simply Wall St is general in nature. We provide commentary based on historical data and analyst forecasts only using an unbiased methodology and our articles are not intended to be financial advice. It does not constitute a recommendation to buy or sell any stock, and does not take account of your objectives, or your financial situation. We aim to bring you long-term focused analysis driven by fundamental data. Note that our analysis may not factor in the latest price-sensitive company announcements or qualitative material. Simply Wall St has no position in any stocks mentioned.
