
 Yahoo Finance
 Codan (ASX:CDA) May Have Issues Allocating Its Capital
If you're not sure where to start when looking for the next multi-bagger, there are a few key trends you should keep an eye out for. Typically, we'll want to notice a trend of growing return on capital employed (ROCE) and alongside that, an expanding base of capital employed. Put simply, these types of businesses are compounding machines, meaning they are continually reinvesting their earnings at ever-higher rates of return. So while Codan (ASX:CDA) has a high ROCE right now, lets see what we can decipher from how returns are changing.
Understanding Return On Capital Employed (ROCE)
For those who don't know, ROCE is a measure of a company's yearly pre-tax profit (its return), relative to the capital employed in the business. To calculate this metric for Codan, this is the formula:
Return on Capital Employed = Earnings Before Interest and Tax (EBIT) ÷ (Total Assets - Current Liabilities)
0.22 = AU$112m ÷ (AU$632m - AU$122m) (Based on the trailing twelve months to December 2022).
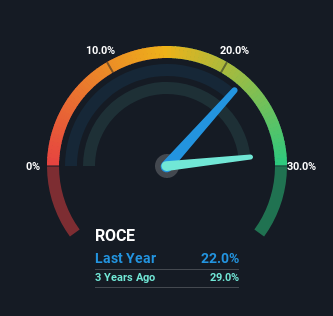
Therefore, Codan has an ROCE of 22%. In absolute terms that's a great return and it's even better than the Electronic industry average of 12%.
See our latest analysis for Codan
Above you can see how the current ROCE for Codan compares to its prior returns on capital, but there's only so much you can tell from the past. If you're interested, you can view the analysts predictions in our free report on analyst forecasts for the company.
What The Trend Of ROCE Can Tell Us
On the surface, the trend of ROCE at Codan doesn't inspire confidence. To be more specific, while the ROCE is still high, it's fallen from 28% where it was five years ago. On the other hand, the company has been employing more capital without a corresponding improvement in sales in the last year, which could suggest these investments are longer term plays. It's worth keeping an eye on the company's earnings from here on to see if these investments do end up contributing to the bottom line.
What We Can Learn From Codan's ROCE
To conclude, we've found that Codan is reinvesting in the business, but returns have been falling. Investors must think there's better things to come because the stock has knocked it out of the park, delivering a 174% gain to shareholders who have held over the last five years. But if the trajectory of these underlying trends continue, we think the likelihood of it being a multi-bagger from here isn't high.
One more thing, we've spotted 1 warning sign facing Codan that you might find interesting.
High returns are a key ingredient to strong performance, so check out our free list ofstocks earning high returns on equity with solid balance sheets.
Have feedback on this article? Concerned about the content? Get in touch with us directly. Alternatively, email editorial-team (at) simplywallst.com.
This article by Simply Wall St is general in nature. We provide commentary based on historical data and analyst forecasts only using an unbiased methodology and our articles are not intended to be financial advice. It does not constitute a recommendation to buy or sell any stock, and does not take account of your objectives, or your financial situation. We aim to bring you long-term focused analysis driven by fundamental data. Note that our analysis may not factor in the latest price-sensitive company announcements or qualitative material. Simply Wall St has no position in any stocks mentioned.
Join A Paid User Research Session
You’ll receive a US$30 Amazon Gift card for 1 hour of your time while helping us build better investing tools for the individual investors like yourself. Sign up here
