
 Yahoo Finance
 Is Cochlear Limited’s (ASX:COH) Balance Sheet Strong Enough To Weather A Storm?

Small-caps and large-caps are wildly popular among investors; however, mid-cap stocks, such as Cochlear Limited (ASX:COH) with a market-capitalization of AU$11.44b, rarely draw their attention. However, generally ignored mid-caps have historically delivered better risk adjusted returns than both of those groups. Let’s take a look at COH’s debt concentration and assess their financial liquidity to get an idea of their ability to fund strategic acquisitions and grow through cyclical pressures. Note that this information is centred entirely on financial health and is a top-level understanding, so I encourage you to look further into COH here.
View our latest analysis for Cochlear
How much cash does COH generate through its operations?
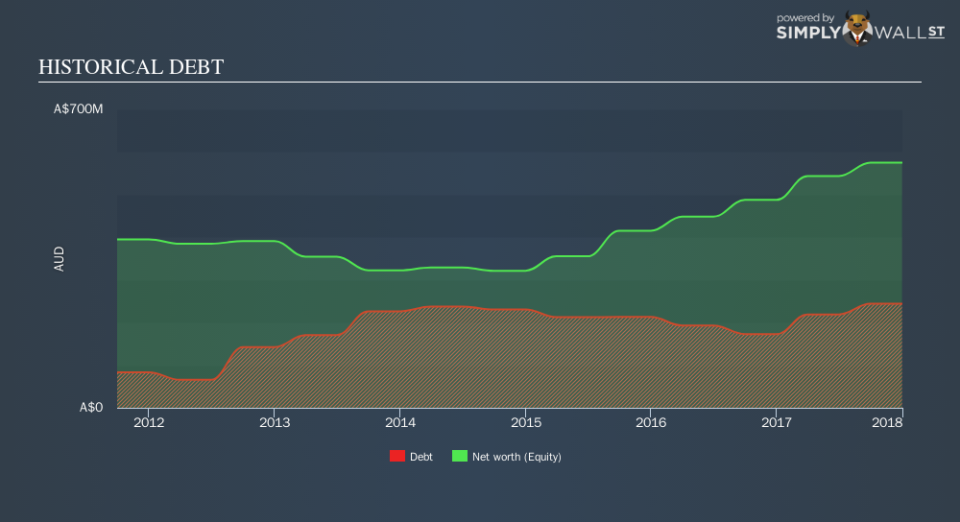
COH’s debt levels surged from AU$172.94m to AU$244.00m over the last 12 months , which comprises of short- and long-term debt. With this growth in debt, COH currently has AU$106.90m remaining in cash and short-term investments , ready to deploy into the business. Moreover, COH has produced cash from operations of AU$250.17m in the last twelve months, leading to an operating cash to total debt ratio of 102.53%, indicating that COH’s current level of operating cash is high enough to cover debt. This ratio can also be a sign of operational efficiency as an alternative to return on assets. In COH’s case, it is able to generate 1.03x cash from its debt capital.
Can COH pay its short-term liabilities?
At the current liabilities level of AU$312.20m liabilities, the company has been able to meet these commitments with a current assets level of AU$621.00m, leading to a 1.99x current account ratio. For Medical Equipment companies, this ratio is within a sensible range since there is a bit of a cash buffer without leaving too much capital in a low-return environment.
Can COH service its debt comfortably?
With debt reaching 42.45% of equity, COH may be thought of as relatively highly levered. This is not unusual for mid-caps as debt tends to be a cheaper and faster source of funding for some businesses. We can test if COH’s debt levels are sustainable by measuring interest payments against earnings of a company. Ideally, earnings before interest and tax (EBIT) should cover net interest by at least three times. For COH, the ratio of 45.19x suggests that interest is comfortably covered, which means that lenders may be less hesitant to lend out more funding as COH’s high interest coverage is seen as responsible and safe practice.
Next Steps:
Although COH’s debt level is towards the higher end of the spectrum, its cash flow coverage seems adequate to meet obligations which means its debt is being efficiently utilised. Since there is also no concerns around COH’s liquidity needs, this may be its optimal capital structure for the time being. I admit this is a fairly basic analysis for COH’s financial health. Other important fundamentals need to be considered alongside. You should continue to research Cochlear to get a better picture of the mid-cap by looking at:
Future Outlook: What are well-informed industry analysts predicting for COH’s future growth? Take a look at our free research report of analyst consensus for COH’s outlook.
Valuation: What is COH worth today? Is the stock undervalued, even when its growth outlook is factored into its intrinsic value? The intrinsic value infographic in our free research report helps visualize whether COH is currently mispriced by the market.
Other High-Performing Stocks: Are there other stocks that provide better prospects with proven track records? Explore our free list of these great stocks here.
To help readers see past the short term volatility of the financial market, we aim to bring you a long-term focused research analysis purely driven by fundamental data. Note that our analysis does not factor in the latest price-sensitive company announcements.
The author is an independent contributor and at the time of publication had no position in the stocks mentioned. For errors that warrant correction please contact the editor at editorial-team@simplywallst.com.
